
In this lab, you will be tasked with developing the methods that will be used to solve a problem. Finding the solution is possible through the use of tools and methods covered in previous labs. In particular, Parts I, II, and III of the Music Festival labs should be used as a reference. However, don’t panic! You will be given the opportunity to collaborate with your peers as described in the instructions below.
The better you are able to collaborate and divide the work, the easier this lab will be.
Sink or swim together!
The City of Pasadena is interested in developing urban planning projects to fight the rising incidence of obesity and promote healthy lifestyles. One of the proposed projects is the placement of “Park and Walk” lots throughout the city. These lots will offer free parking for the first 90 minutes as an incentive for commuters to walk to multiple businesses and points of interest in the city rather than drive from place to place.
The project is in the early planning stages. It is your job to locate a suitable site (a single parcel) for a potential “Park and Walk” lot. The parcel criteria include the following:
The County of Los Angeles uses the State Plane spatial reference system. You'll be working in NAD 83, California State Plane Zone V, Feet for this entire lab.
By now you should be familiar with file management protocols for GIS. In a workplace setting, having consistent file management protocols is necessary to prevent errors and lost data.
Set up your standard workspace for this project within a parent folder and 3 sub-folders: originals, working, final.
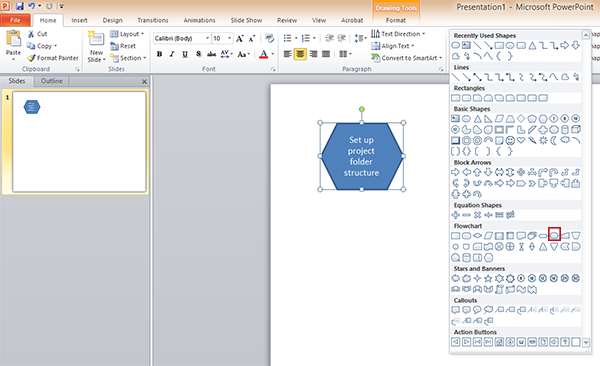
Later in this lab, you will be creating a flowchart as a graphic representation of your GIS process workflows. These flowcharts are a concise and effective graphical communication technique. The use of flowcharts are a common practice in the geospatial industry. Flowcharts are often used to plan out analysis steps ahead of time by testing the structure, order, and logic of GIS operations to obtain a specific result. However learning to anticipate which GIS operations you will need to use takes practice. For this lab we will perform a similar exercise by first creating a simple outline instead of a flowchart.
Open a blank Microsoft Word document and write your name and date at the top.
Begin an outline for this analysis. A good starting point is to ask yourself, "what is the final goal of the analysis"? In this case it is to find the best location for the park and walk lots.
Next ask yourself,"What is the criteria that I will use to determine the location?" This has been provided for you, but if it had not, you would probably start with building a list of the criteria that you would use.
At this point you would begin your outline by asking, "What data do I need to get started?". Your data is based on the criteria.
The beginning of your outline might look like the following:
Use the criteria provided in the lab scenario above to plan your analysis in the form of a simple outline. Try to anticipate the various selections and overlay operations you might need to perform to solve the problem. Don't make it too detailed and don't worry about getting it right the first time. Creating a preliminary work flow takes practice.
Note: Learning how to complete this step will be vital to planning your final project!
GIS work is nearly always a collaborative process. For this reason, developing communication and team work skills is vital.
Once you have completed your preliminary outline, compare it with as many classmates as possible.
If necessary, revise your workflow, based on your discussion with your clasmates. Once you have a solid analysis workflow planned out, you can proceed with the lab. You may complete the remainder of this lab in collaboration with your peers, however each must write their own lab report.
Ideally, in a professional setting, an outline might be completed at this stage. With your planned analysis fresh in your mind, it might be easier for some students to complete this flowchart right away. However, this step may be completed after the analysis is compete, during the report writing process.
Flowcharts are useful for planning the steps of your analysis, but also for helping others to understand your methods as well. Keep in mind that it takes practice to be able to create a flowchart as a planning tool before your analysis is complete.
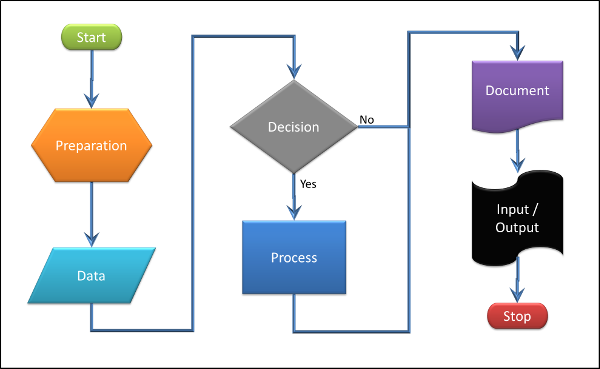
Typical Symbols Used to Create the Flow Charts in 270 (Sample Power Point File).
To build our flowchart, we will be using Microsoft Power Point
Your flowchart should contain broad "Upper Level" steps. That means you don't want to over-complicate your flow chart with a high level of detail. There should be just enough detail to communicate your methods to the reader and potentially to allow another experienced GIS technician to follow your steps.
Use your workflow outline to help guide this process.
Recall that our first step in the outline was to create a project folder structure. This will also be the first step in our flowchart.
Recall that our next step was to acquire data from the Los Angeles County GIS Data Portal. Then after that, we completed a QAQC form for each dataset.
Refer to the flow chart in the Music festival lab instructions for guidance
Now it's up to you to complete this flowchart and add it to your lab report. Use different polygon shapes for decisions, processes, and data. Refer to the Flowchart Supplementary learning module for more detailed instructions on how to create a flow chart. The link is located in the Activities tab of the HSU Geospatial Program website.
The city of Los Angeles has an extensive collection of GIS datasets. These datasets are accessible through the Los Angeles GIS Data Portal. In this step, you will find the data portal and download what we need to complete this analysis.
The datasets we have to find include:
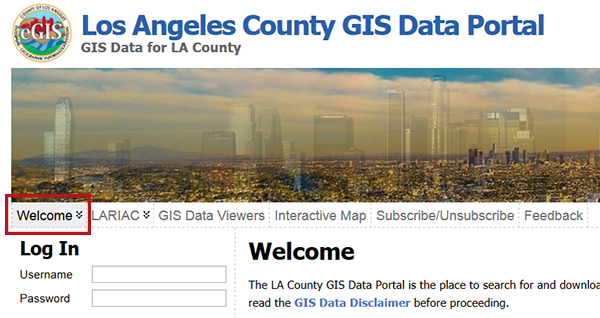
Use Google to find the Los Angeles County data portal. Once there, click on the Welcome link and take a moment to read about the website and the GIS Data Disclaimer before proceeding.
If you have ear buds, watch the instructional videos for using the site. Otherwise, read the written instructions. Try to watch the video when you get a chance.
Locate and download the City Boundaries in Los Angeles by using "City Boundary Polygons" as a key word. This video on YouTube may help.
Check for metadata that may be published on the GIS download page (if any). Load the data into ArcMap and read the metadata embedded in the shapefile using the ISO19139 metadata specification settings used in previous labs.
Note: Either the website or the embedded metadata will be your primary sources of information about each layer.
It may be helpful to remind yourself that the QAQC form is designed to discover any areas of concern about the data and to inform your peers about this information.
Download a QAQC Form. Complete the form for the City Boundary shapefile. Be sure to save the PDF to your finals folder using the name of the dataset. You will need to turn this and other QAQC forms later on with your report.
You may collaborate on this step as well, with each lab partner performing the QAQC on a different dataset. If this is the case, be sure you each have a copy of all the QAQC forms.
For the next steps you should locate the remaining data on the Los Angeles GIS Data Portal. Using the following search key words may help.
Warning: The bikeways data is a bit challenging to find due to recent changes on the Los Angeles GIS Data Portal. If you cannot find it by navigating through the above website, you can download the data here: LA 2012 Bikeways. Additionally, Bikeways GIS data are often found in KMZ or KML format, a popular file format often used in Google Earth. ArcGIS software does not natively use KMZ or KML files, but it is possible for ArcMap to convert it to a format it can use.
Try to solve this challenge with your peers.
Be sure to read the metadata and complete Standardized Quality Assurance Quality Control (QAQC)Procedure for each file you will use for the analysis. As noted above, you may collaborate with your peers.
For the remainder of the lab, you and your peers will try and complete the objective of this analysis based on the outline you have created.
© Copyright 2018 HSU - All rights reserved.