The Music Festival, Part 1 - Acquiring Data
Introduction
The Tobler Music Group is looking at planning a music festival in Humboldt County. It is your job to gather all of the data, and ultimately select a final location and provide a preliminary environmental assessment of the site. In, "The Music Festival, Part 1 – Acquiring Data," you will navigate through GIS data portals and gather the data you will need to complete the next two labs.
This data will include the following:
- A county zoning layer
- A parcels layer
- A roads layer
- A county boundary layer
- A hydrography (rivers and streams) layer
- A satellite image showing Humboldt county
- A wetlands layer
Note: Part of GIS is being able to work through downloading data from websites which sometimes change and may not be available when you want them to be. Please take your time with this lab, make sure you are getting the correct data, and examine each layer's files and visually. Otherwise, you will not be prepared to move on to the next labs.
Learning Outcomes
- Find, acquire, and evaluate data (raster and vector) from the world wide web.
- Evaluate appropriate use of data through metadata and visual inspection.
- Acquire data from Humboldt County Web GIS, USDA NRCS, EarthExplorer USGS, and the National Wetlands Inventory.
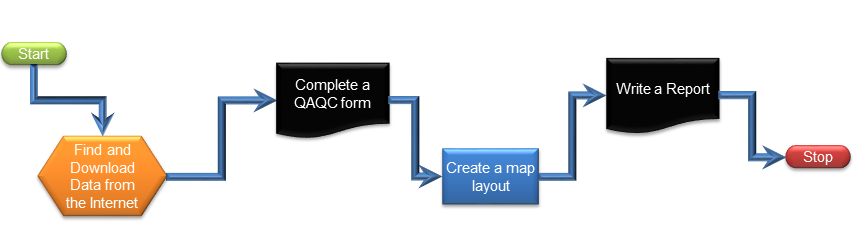
Walk Through: Downloading data for Humboldt County
- Create a Folder Structure for your data.
If you need a reminder on how to setup a Folder Structure, revisit Lab 1: Dream Island.
Humboldt County's Planning Division collects and develops GIS data and software for the initial purpose of supporting the General Plan Update. The goals of the division have expanded to meet the GIS needs of federal, state, and local agencies. This data is readily available for free download through the Humboldt County GIS Data Download web page. The data comes in both raster and vector formats.
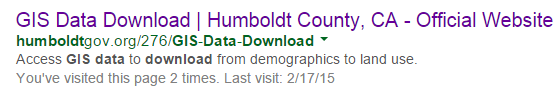
- Navigate to Google in your web browser and search for Humboldt County GIS Data Download.
- Look for a link that indicated GIS data download. It may be the fourth or fifth one down. Click on the link to open the page.
- Humboldt County changes their web site periodically so you may need to go through several more clicks to find the actual data download page.
- Take a moment to read through the Disclaimer and Data Projection sections to become familiar with the data available.
- Scroll down the page and skim the contents to discover what types of data the County of Humboldt can provide.
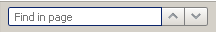
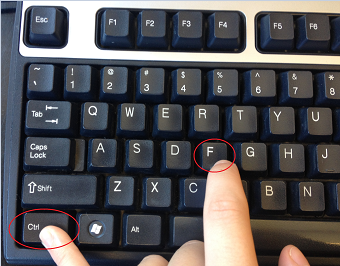
Since there are many data sets to be found, we want to have a way to expedite our search for specific data sets. Do do this we will search the contents of this page based on specific text following the step below:
- Hold down Ctrl and F. A search window will pop up in the bottom left hand corner when using Firefox:
The first dataset we will need is a Zoning layer with land use zone categories information.
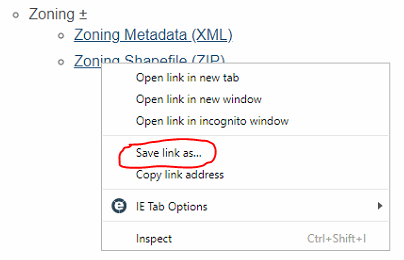
- Type Zoning in the search field. The page should highlight all of the text with zoning in it. The one that we want is under the Land Use section with the title Zoning. Right-click Zoning Shapefile (ZIP) and "Save Link As..." then navigate to the Originals folder to save the zip file.
- Un-Zip the downloaded file in the "Originals" folder by right-clicking the file, then selecting 7-Zip, then selecting "extract here".
- A Quality Assurance/ Quality Control form allows you to evaluate the data. Open a blank ArcMap document and load the shapefile onto the map. Adjust the metadata settings if necessary and open the metadata for this shapefile. Complete a QAQC Form for this dataset. Page 2 of the form has instructions on how to complete it.
- Create a small map layout that displays this dataset for your report. Symbolize the layer to show the different zone categories. Follow the Symbology Tutorial to learn how to symbolize a map. Your final map should be no larger than 6 inches in any direction, but may be as small as 3 or 4 inches wide if you like. You should include the minimum map elements appropriate for this size (north arrow, scale bar). A caption in the report should be used instead of a title in the map layout. You may include a legend in the map or copy and paste the legend directly into your word document and add a clear, descriptive caption for it.
Skill Drill: Repeat Above for Additional Data sets
- Repeat the download and evaluation process for Parcels (under Frequently Requested Data Sets), Humboldt County GIS Roadway Center line, and Humboldt County (under the Administrative Boundaries section).
- Normally, you would fill out QAQC forms for each of the layers. To save time in this lab, only fill out an additional QAQC form for the Parcels layer.
If you are working with other classmates in the lab, to save additional time, you may work with the person sitting next to you to complete the QAQC form. Turn to your right and left and introduce yourself!
- Save your files in an organized manner. You will need to create several map layouts for the turn-in assignment. Read the turn-in instructions about the map layouts you will need to create. You will have all the required data by the end of this lab. For each map layout, re-read instruction number 10 about the map expectations. When symbolizing you need to be creative and use an attribute field that makes more sense to categorize your data
Skill Drill: Other Download Sites
In the next series of steps you will work through several different websites to find and download data sets for our music festival scenario. This includes data from the U.S. Department of Agriculture (USDA), the U.S. Geological Survey (USGS), and the U.S Fish and Wildlife Service (USFWS). These are very common sources of GIS data and you may eventually revisit these pages for your final project. The following steps show you how to gather GIS data.
Working on GIS project is always a collaborative process. For the next steps, please feel free to help each other navigate the websites below. Since websites are constantly updated, you may notice differences between the settings or navigation tabs shown in the instructions and the current websites. Use the knowledge you gained from lectures to find the appropriate paths to evaluate and download the data.
Hydrology (Rivers and Streams) Shapefile
USDA NRCS Geospatial Data Gateway (GDG) is a national database which provides environmental and natural resources raster or vector data. This data is free when downloaded directly from the web, but can also be shipped via CD or DVD at a price.
We'll access the GDG to obtain a shapefile with the streams and rivers for California that is part of the National Hydrography Dataset (NHD).
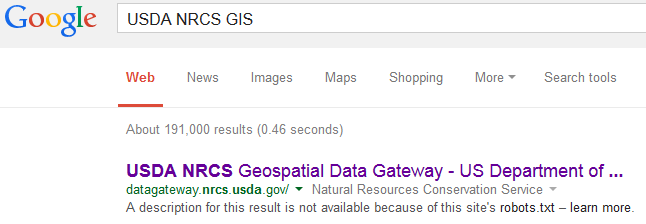
- Navigate to Google and enter USDA NRCS GIS and select the link shown below:
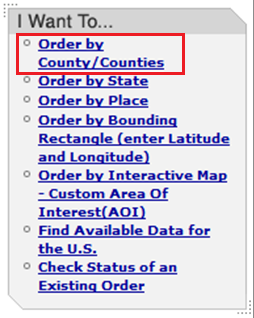
- Select Order by Country/Counties in the lower right hand corner of the website:
- From the drop down menu select "California"
- Highlight "Humboldt" in the list that appears and click the right arrow.
- Click Submit Selected Counties.
- Scroll through the available options to familiarize yourself with the data available through the Geospatial Data Gateway.
- Click on the blue identify icon to read a more in depth description of the data:
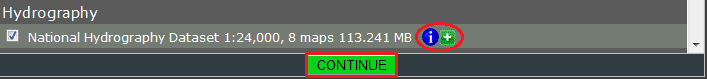
- Check the "hydrography" dataset and click "Continue" when finished.
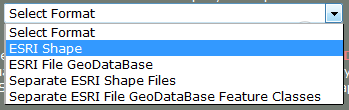
- Select the ESRI Shape format:
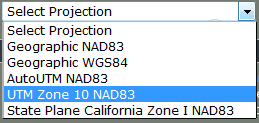
- Select UTM Zone 10 NAD83 as the projection for this shapefile:
- Select "Download" as the order delivery method.
This will ultimately provide a download link to your email address. Data obtained in this format takes longer to obtain and requires processing.
- Once you have finished filling in your personal information, click "Continue".
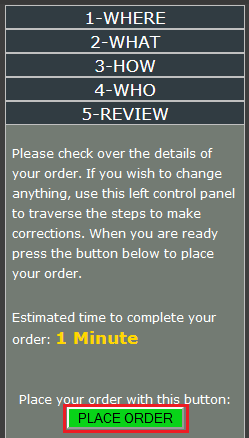
- Click Place Order in the left hand panel:
- You can either wait for the order to complete or check your email for a message indicating your order is ready.
If this takes too long, you can also obtain the file from the "Y" drive on campus network: "Y:\StaticData\_Areas Of Interest\Humboldt_County\Hydrography\" or here : Hydrography
.
- The file we are interested in is"nhd24kst_l_ca023.shp". Create a small map layout of the shapefile "nhd24kst_l_ca023.shp" for your report. You may want to re-read instruction number 10 again about the map expectations.
LandSat Images from the USGS
USGS EarthExplorer is a service that allows you to search and download active and passive remote sensing data, as well as cartographic products obtained through USGS at the national level. This service provides a Google Map interface to select your area of interest and preview the data available for bulk downloading.
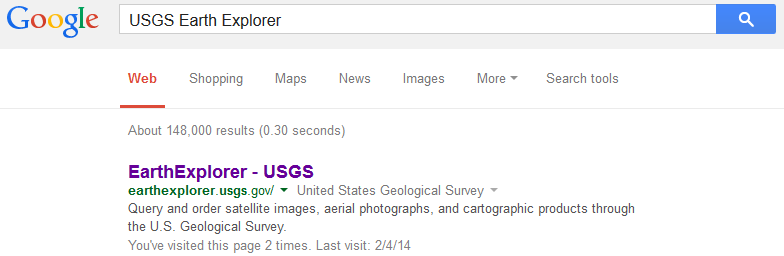
- Navigate to Google and search EarthExplorer USGS. Click on the link shown below:
- You will need an active ERS account to be able to download data. It is more convenient to login and/ register a new account at this moment. You can do this later but you may need to repeat some of the steps below.
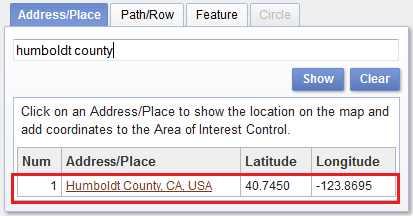
- Under the Address/Place tab, type in "Humboldt County", click "Show", and select the option that becomes available:
- Click on the "Data Sets" tab.
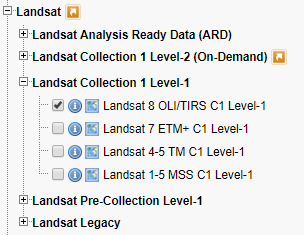
- Expand the Landsat option and then Landsat Collection 1 Level-1 and select Landsat 8 OLI/TIRS C1 Level-1 to obtain the most recent satellite imagery from LandSat 8:
- Click on the blue identify icon (one with an "i" in it) to obtain additional information on the dataset.
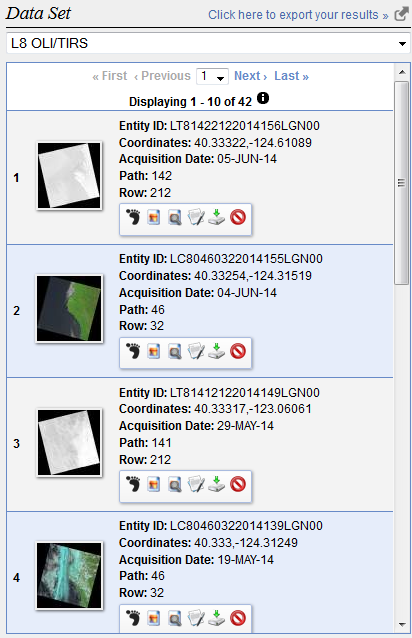
- Leave Additional Criteria at default settings and click on Results at the bottom of the page.
- Navigate through the Data Set and select the satellite image that would work best as a basemap for Humboldt County. You can click on the image icon next to the foot icon to see a preview of the image on the map.
You do not want a basemap that has extensive cloud cover interference!
- Select Download Options:
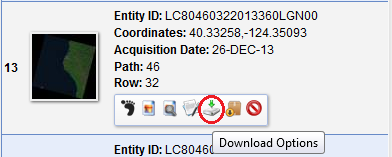
- From Download Options, select the "Download" button next to "LandsatLook images with Geographic Reference"
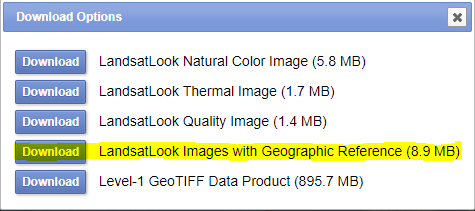
The other options are not relevant for the purpose of this lab, but keep them in mind for the future.
- After the "zip" has downloaded and you un-compress it, you'll see there are a number of .tif files to choose from. You'll want the one that shows a regular image preview, not the one that is "Thermal Infrared" or "TIR".
- You may wonder why this image does not cover all of Humboldt County. We'll only be using this as a background for a small area within Humboldt County and we did not want to make you download two images and mosaic them together yet (more on this later in the class).
Wetlands
The U.S. Fish and Wildlife Service National Wetlands Inventory is a comprehensive database that provides vector data on the Nation's wetlands and deep-water habitats.
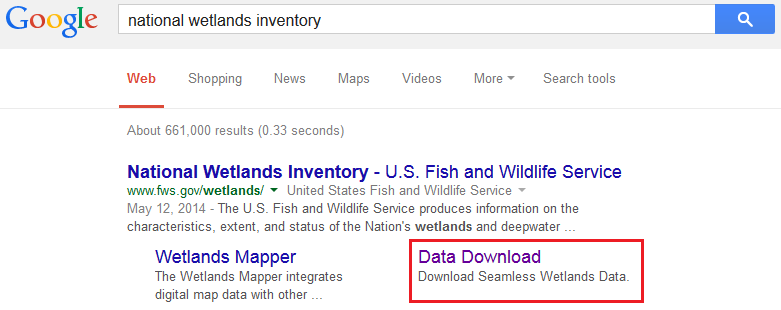
- Navigate again to Google and search National Wetlands Inventory. Select Download Data from the search results:
- Follow the directions and read the sections labeled: Disclaimer, Data Limitations, Exclusions and Precautions, and the Wetlands Geodatabase Under Caution.
Warning! The last time we tried the "Wetlands Mapper" it put up a big error window and would not let us download data. The instructions below have been updated with a work-around.
- From the "Wetlands Data" menu, select "Download Data"
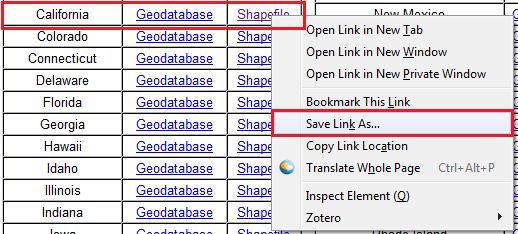
- In the body of the web page, select "Data by State"
- Right click on the shapefile and save the data to your originals folder.
If this takes too long, you can also obtain the file from the "Y" drive: "Y:\StaticData\_Areas Of Interest\California\" or here: Wetlands.
- The file we are interested in from the USFWS website is currently called "CA_wetlands.shp" (or "CA_Wetlands_North.shp"). Create a map layout of "CA_wetlands.shp" for your report. You may want to re-read instruction number 10 about the map expectations.
- Remember to back up your data. When using the Google Drive, click the link below for a video that will show you how to make sure your data is completely backed up before you log out.
Using Google File Stream
Summary of Data Download Links
Resources
Learning Module on Creating Reports