Create your dream island paradise
Introduction
In this lab, you will become acquainted with the ArcMap interface. You will learn how to create and edit shapefiles (point, polyline, and polygon vector files). You will add attributes to the files you create, and work with basic cartographic elements. In the end, you'll have a beautiful map of your own dream island.
Learning Outcomes
- Establish an understanding of a standardized folder structure.
- Use ArcMap user interface and basic navigation tools.
- Articulate vector data types; point, polyline, polygon.
- Create new shapefiles.
- Create new features
- Estimate Uncertainty of Digitized spatial data
- Present a report using MS Word template.
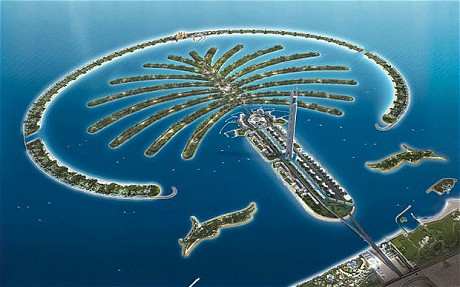
Dream Island inspirations:
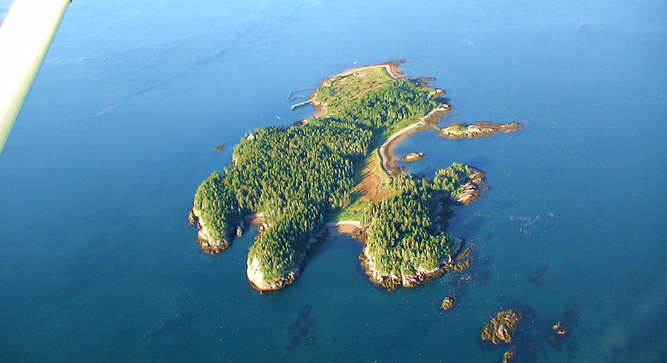
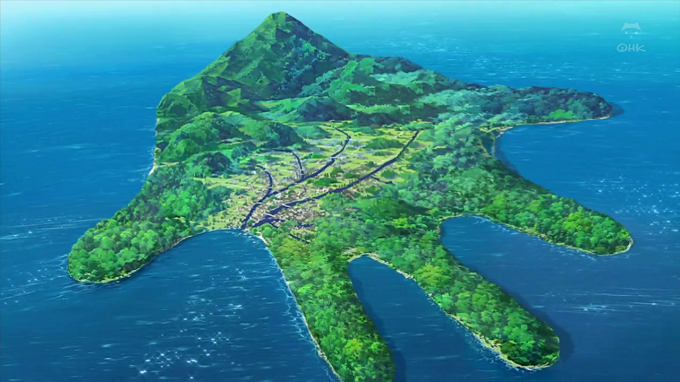
Feel free to watch the demo of this lab below.
Note: This video is for demonstration purposes only. The workspace names and data sources are no longer valid. The step-by-step instructions for this lab are provided below the video.
If you are using Internet Explorer, you will need version 11 or newer to view the embedded video.
Walk Through: Setting up a workspace
You will begin by creating a folder structure or "workspace" that will keep your files organized and prevent any confusion as you work with multiple data sets in the future.
- Log into a campus computer with your student ID and password.
- On the Desktop:
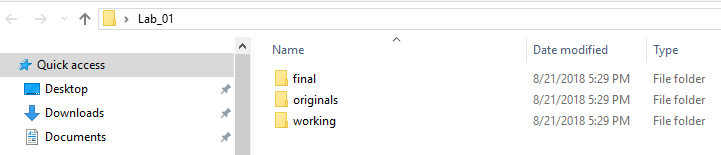
- Create a new folder and name it "Lab_01".
- Within the folder named “Lab_01”, create three subfolders as below:
- Originals
- Working
- Final
Your workspace should now look like the image below:
Creating a folder structure is best practice for organizing your files. It makes them easy to locate and helps to prevent confusion when there are multiple versions of the same file. Your original folder will contain original unaltered data. Your working folder will contain data you create or alter through GIS analysis operations. The final folder contains any output, such as JPG, PDF maps, QAQC forms, or lab reports in the form of Microsoft Word or pdf documents.
Now we will add a background dataset for the world to our local folder.
Note: The "X" drive is no longer available so please use the instructions below to obtain the data.
- Right click here and save the "zip" file to your "Originals" folder. The file is from the Natural Earth website.
- In Windows Explorer, right click on the "zip" file and select "7-Zip -> Extract Here". The shapefile will be decompressed and should appear in the folder.
Next we will add our basemap data to ArcMap and choose our dream island location.
- Open ArcMap 10.x.
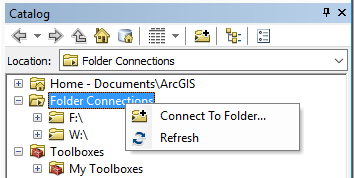
- Select “Catalog” tab on the upper right hand corner of the ArcMap interface.
- Right Click on "Folder Connections" and select "Connect to Folder".
- Navigate to "This PC", then "Desktop", then "Lab_01" and at the bottom of the Connect To Folder window, click "OK". This will add a directory like "C:\Users\dg1688\Desktop\Lab_01" to the catalog.
- Within the "C:\Users\dg1688\Desktop\Lab_01" folder in Catalog, navigate to the “Originals” folder.
- Drag “ne_50m_admin_0_countries.shp” to the "Table of Contents" window on the left hand side of the ArcMap interface.
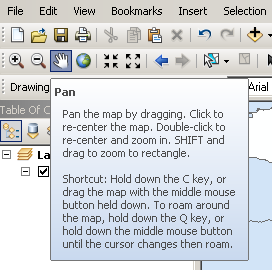
- Use the zoom in/out and pan tools to explore the map.
- Pick an area for your new island.
- To zoom, select the magnifying glass with the plus symbol, and click on the area you’d like to zoom into. To zoom out, choose the magnifying glass with the minus symbol. You can also click and drag with either tool to zoom in/out on a large area.
- Create a spatial bookmark once you have chosen the location of your dream island. This spatial bookmark will keep us from losing our place if we accidentally pan or zoom away from our island location.
- Bookmarks → Create Bookmark.
- Name your bookmark “Island Location”
Walk Through: Creating Shapefiles
Now we will create shapefiles in ArcMap that will contain our island shape, trees, and rivers/streams/roads.
- In the ArcCatalog window on the right hand side of the ArcMap interface, right click on your “Working” folder (if this window has minimized, expand it by clicking on the “Catalog” tab on the right hand side of the ArcMap interface).
- Hover your mouse over “New.”
- Select “Shapefile.”
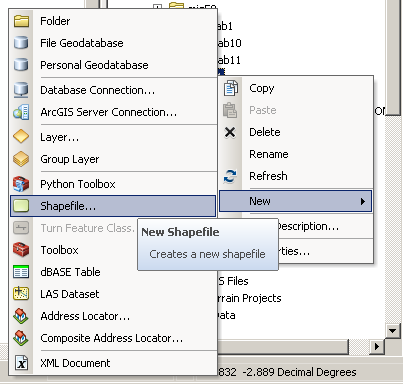
- Name the new shapefile “Island.”
- Select “Polygon” as the feature type.
- Select Edit underneath the spatial reference description window.
- Expand geographic coordinates folder at the top of the list.
- Scroll down to “World” and expand the folder.
- Select “WGS 1984” (at the bottom of the “World” folder).
- Hit “OK”.
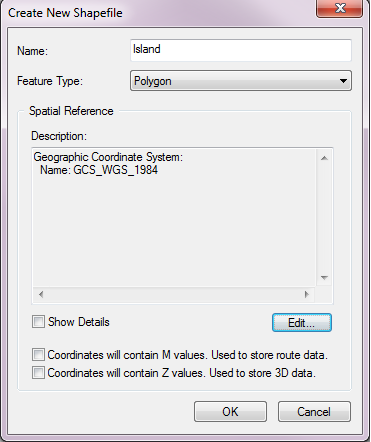
- Select “OK” to finish creating the new shapefile.
- Your new shapefile has been automatically added to the Table of Contents (See the window on the left).
- Repeat steps # 21-15 to create shapefiles for each feature type of vector file (polyline and point).
- Name the next file “Trees” and select “point” feature type.
- Name the third file “Roads” or “Streams” and select “polyline” feature type. (This is up to you because you must be creative with your island. Is it a deserted island with only streams, or a bustling tourist destination with many roads?)
- Remember to set the coordinate system to WGS 1984 for each file .
Skill Drill 1: Creating Shapefiles
- Set Relative paths in ArcMap settings.
- Click on “File” on the toolbar at the top of the ArcMap interface.
- Select “Map Document Properties”.
- Make sure the box labeled “Store relative pathnames to data sources” is checked.
- Click “OK”.
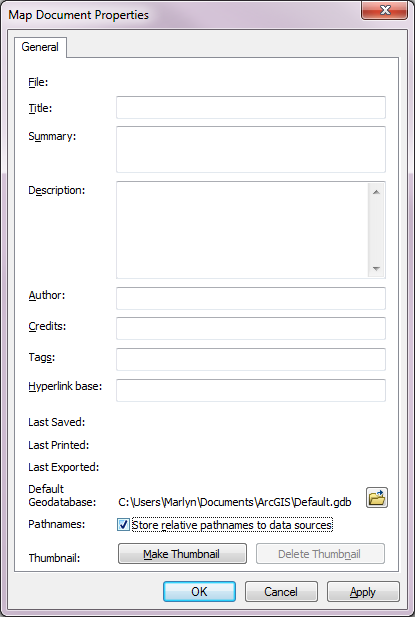
This ensures that the .mxd will be able to locate your files even if their file path names have been changed.
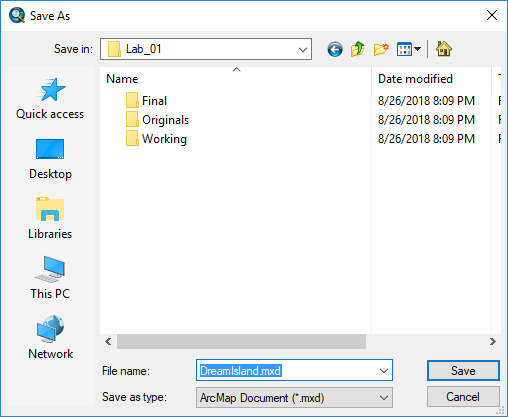
- Save your ArcMap document by selecting the save icon on the upper toolbar of the ArcMap interface.
- Navigate to the Desktop and save the .mxd (ArcMap Document File) to your Lab_01 workspace folder.
- Use the name of your island as the title of this file, so it will be easy to locate later .
Walk Through: Digitizing
Now we can begin drawing our island by editing the features of the shapefiles we just created.
- Right click on your Island in the Table of Contents.
- Hover your mouse over “Edit Features” .
- Select “Start Editing”.
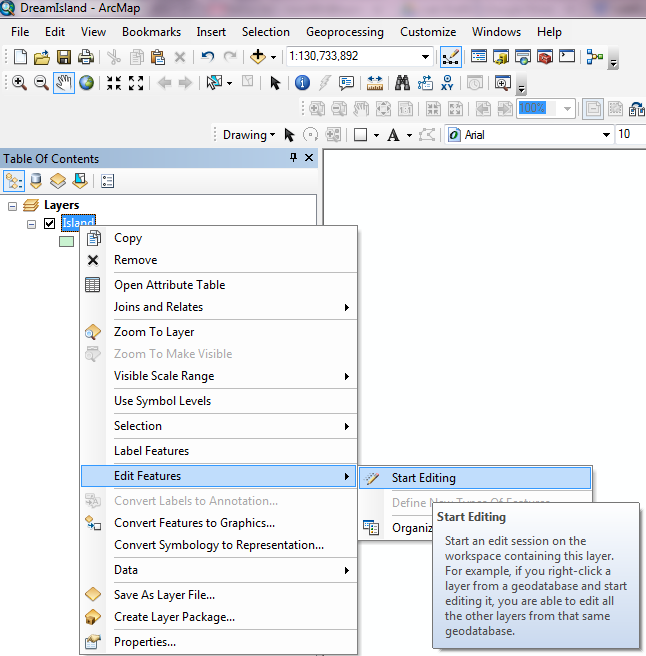
- This will add an editor toolbar to your ArcMap interface (if it was not there already).
- It will also open a “Create Features” window that will allow us to edit the shapefile.
If you somehow lose your Editor Toolbar, you can bring it back by selecting the customize menu from the top, then selecting toolbars, then editor. If you lose your Create Features Window, you can bring it back by clicking on the last button to the right on the Editor Toolbar.
- In the “Create Features” window, select your “Island” shapefile icon.
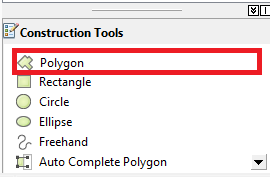
- A “Construction Tools” panel will appear at the bottom of the Create Features toolbar.
- Select “Polygon” in this window.
- Your cursor will become a cross hair symbol when you move it into the map window.
- Click your mouse on a space where you’d like to begin your island border.
- Continue clicking once to add new points that add to the border of the island.
- When you are happy with the shape and size of your island, double click to add a final point, this will close your polygon
- On the editor toolbar, click on the word “Editor”.
- Select “Save Edits” from the drop down menu.
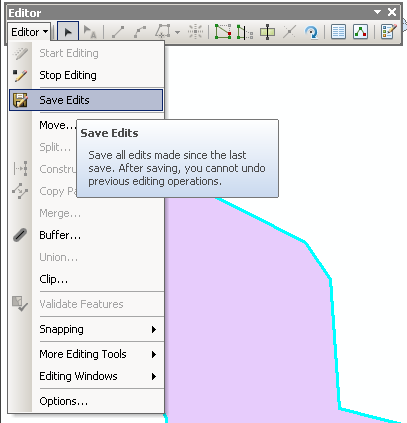
- Once saved, select “Stop Editing” from the drop down menu.
Skill Drill 2: Digitizing
- Repeat steps # 29-32 to add trees, rivers or roads to your point and polyline shapefiles.
- When editing the trees shapefile, use the "Point" "Construction Tool"..
- To create your roads/streams/rivers, use the "Freehand" "Construction Tool". (Keep in mind that you will name these streams later, so don’t plan on creating 200 streams.)
- Change the colors of your island/trees/rivers/roads by adjusting the symbology of each shapefile.
- Select the rectangle displayed underneath the label “Island” in the table of contents.
- A symbol selector window will pop up, choose an appropriate fill color and outline color for your island.
- You can adjust the outline color widths as well.
- Click OK when you are done, and see that the icon for your feature has updated itself in the Table of Contents.
- Repeat the process for rivers or roads (choose an appropriate color and width of the line).
- For the trees, in the symbol selector window, type “Tree” into the search box at the top of the window.
- Select a tree style you’d like to use, and make sure it is colored appropriately.
- Click OK.
- To make the trees different sizes, right click on the shapefile name “Trees” in the table of contents.
- Select "Properties".
- Select the “Symbology” tab at the top of the window.
- Click on the “Advanced” pull down menu.
- Select the “Size” option.
- In the “Size Points by Value in this field:” pull down menu, select “Random”.
- Set the Random minimum to “1” and the Maximum to “50”.
- Click OK.
- Click OK.
- When you are happy with your island and its features, save your edits, and stop editing. Also be sure to save your updated .mxd file.
If you are having trouble with the polyline snapping to the edges of your island polygon, zoom farther in on your island location.
Your layers may need to be rearranged in the table of contents in order to see what you are digitizing. You can change the order of drawing by "dragging" the layers up and down in the "Table of Contents".
Skill Drill 3: Editing the Attribute Table
Next we will add names to the rivers and/or roads you created.
- Right click on your polyline shapefile.
- Select “Open Attribute Table”.
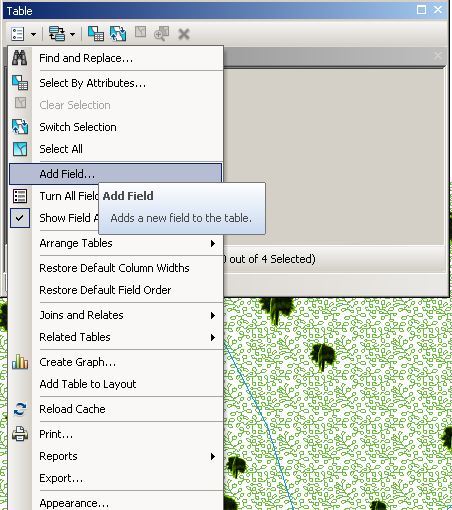
- From the pull down arrow menu at the top of the attribute table window, select “Add Field”. Be sure you have stopped editing or this will not work!
- In the new “Add Field” Window, type “Name” into the “Name” window.
- Set the Type to “Text”’.
- Click OK.
- On the Editor Window toolbar, select “Start Editing”.
- Double click on the first line of the attribute table, and type a name for your road and/or stream/river.
- Continue double-clicking on the lines to name each feature.
- When you are finished typing the names of your lines, select “Save Edits” and “Stop Editing” in the Editor toolbar.
- Select the “Identify” icon in the tools toolbar and click on one of your rivers/streams.
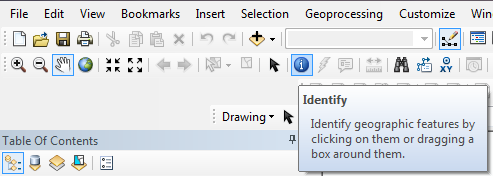
- This will bring up the “Identify” window, and you will be able to see the name of that river/road/stream.
- Save your .mxd.
- Admire your beautiful island.
Note: The calculation for area is no longer a required step and has been removed.
Create the Map and Bring it into MS-Word
Export your island as a high quality JPG, minimum 300 dpi, and upload the JPG to Canvas.
To prepare the map for export as a 6 x 6 inch map:
- Select the "File" menu
- Select "Page and Print Setup"
- Uncheck the box that says “Use Printer Paper Settings”
- Change the "Page" height and width to 6 inches
- If you are not currently in layout view, select “View” then “Layout View”
- The paper is now 6 x 6, but the map is still 8.5 by 11. Change the map size by either right clicking on the map or right clicking on the dataframe (“Layers”) in the table of contents and then selecting "Properties".
- Select the “Size and Position” tab.
- Change the height and the width values to 6 inches.
- Change the X and Y position values to 0 inches.
- When you click "OK" you should see your map perfectly alighned with your page.
Now we will export it as a 300 dpi jpg file.
- Make sure your entire island is visible on your screen.
- Select File → Export Map.
- Choose JPG as the file type.
- Change the resolution from 96 dpi to 300 dpi.
- Be sure to save to your "Final" Folder.
Preparing Your Map to Meet a Standard Report Quality
Every map should have some key cartographic elements that aid the viewer in understanding the communication of that map and in some cases document the source of the geographic information used. To add the necessary cartographic elements to your map:
- From the ArcMap main menu, select View then Layout View
- Click on the “Insert” tab from the ArcMap main menu, and take a look at the cartographic elements that can be added (Legend, Scale Bar, North Arrow, etc.)
- Use these tools to add, at minimum, a scale bar and a north arrow and a legend
- Optional: Add any other appropriate cartographic elements as you see necessary. Refer to the Basic Cartographic Design Reference for clarity
- Repeat steps 58 - 62 to export your report quality map.
Note: Map titles often don't make much sense because of the limited number of words you can squeeze in. It is therefore a good practice to not include a title in the map but instead use a clear, descriptive figure caption beneath the map in your report. Also remember that figure captions are always required in reports so a map title and a caption becomes redundancy!
Preparing a Locator Map
A locator map is a simple map that shows the location of your specific study area within its larger and presumably more familiar context.
- Follow this link: Creating Locator Maps to learn about creating a good locator map. Just make sure you use the WGS 1984 Geographic Coordinate System for this lab.
Backing up your work
- When you are done for today or want to take a break, be sure to back up your data to make sure you don’t lose all of your hard work!
- Save your .mxd
- Close ArcMap
- Copy the Lab_01 folder to your Google Drive or U:\ Drive and if possible an additional thumb drive. You can also zip and email your Lab_01 folder to yourself.
Note: Any data that is left on the Desktop of the lab computer will be deleted after 24 hours so make sure you back-up everything you will need for the future.