Lab: Creating Locator Maps
If you were from Humboldt County, you might recognize the map below. However, if you are some somewhere else, or were just not familiar with the shape of the county, you might struggle to know where the map was located. Providing a "locator" map allows the reader of a map or report to immediately recognize where they are.
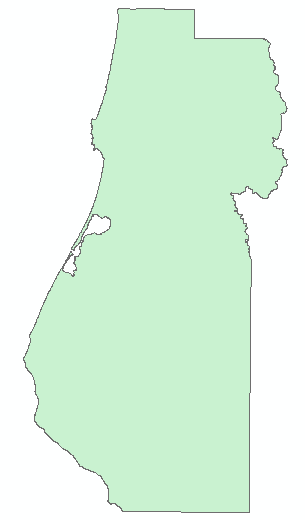
The map below shows us that the preceding map is of Humboldt County in northwestern California. The instructions below will guide you through making this map.
Data
This data set contains shapefiles for: Humboldt County, the United States of America's states, and global countries. All the data was projected into a custom Alber's projection for the west coast of the US. The data is from Natural Earth and the old USGS National Atlas web site.
Basic Locator Map
This skill will create a basic locator map for Humboldt County.
1. To start, we want to load the Humboldt County layer, the US States Layer, and a country layer.
2. In the "Table of Contents", put the Humboldt County layer on top, then the US States, and then the countries layer.
3. Give the Humboldt County layer a relatively bright color that matches the "feel" of Humboldt County. Here I used a mid-green but you can choose your own colors.
4. We want to make the US look more related to Humboldt than other spatial data but also give it less focus so I've used a lighter color of green.
5. We want to de-emphasize Mexico and Canada further so I've used a light yellow for their polygons.
6. Right click on the "Layers" (or "Data Frame") and select the "Frame" tab. In the "Background" box, set the background to a light blue to represent the ocean. You should now have something that looks like the following:
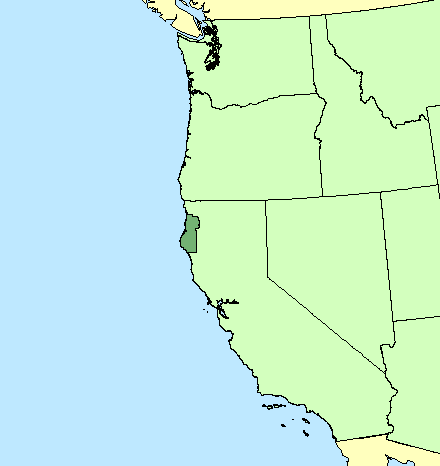
Note: In this case I have used a projection that is optimized for the west coast of the United States.
Creating Locator Maps Using GIMP and PowerPoint
To do professional level GIS documents, you really need an image editor and an illustration package. Image editors, like GIMP, MS-Paint, and PhotoShop allow you to crop and resize raster images including those exported from ArcMap. Illustration packages like Adobe Illustrator allow you to create and manipulate vector graphics to make stunning professional documents. MS-PowerPoint, was original created for making presentation but it also has many of the features of an illustration package. PowerPoint can be used to add a variety of graphics to maps and even create final maps and posters from data created in a GIS application. In this case, we'll use PowerPoint to finalize our locator map.
1. We'll want to switch to "Layout View" in ArcGIS and fit our locator map to the page.
2. Since it is pretty obvious which way is north in our locator map we don't need a north arrow. Also, since we are only looking to identify Humboldt County, we don't need a legend. The scale is not important either so we don't even need a scale bar.
3. We might be able to get away with a screen capture but to make a high quality locator map, I need to "Export" the map from ArcGIS by clicking on "File" and selecting "Export Map...".
4. Specify a resolution of at least 300dpi and use TIF as the file format.
5. Save the map to a file in your "Finals" folder.
Note: below I've used the image editor GIMP but any image editor should work.
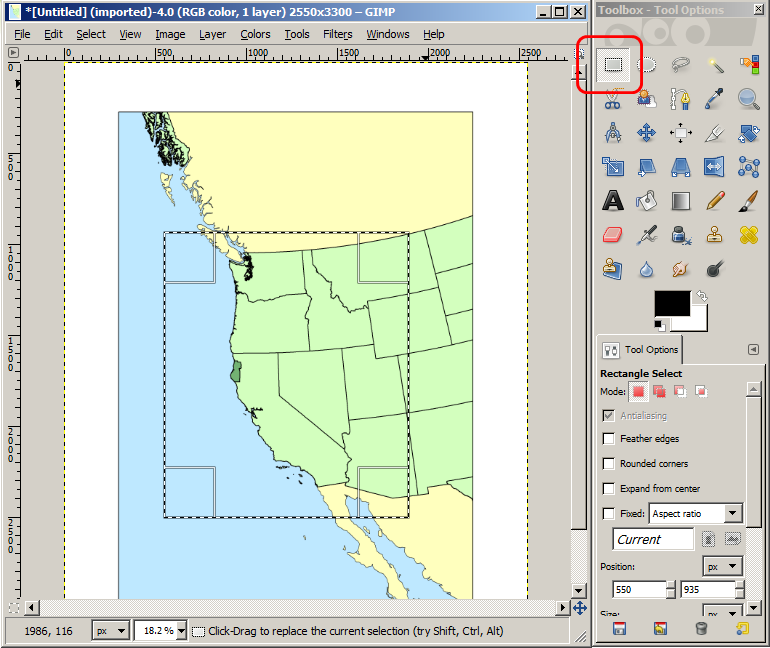
6. Open GIMP and then open the file from the "File" menu.
7. Use the "Rectangle Select Tool" to select just the portion of the map you want to include in your locator map.
8. Select "Copy" from the "Edit" menu.
9. Open PowerPoint and paste the image into PowerPoint.
10. Grab the corners, and only the corners, of the image and size it to fit on the page.
11. Right click on the image and select "Format Picture" and then select "Line Color".
12. Select "Solid Color" and then pick an appropriate color from the "Color" popup (like black). This will add a "neat line" around the image.
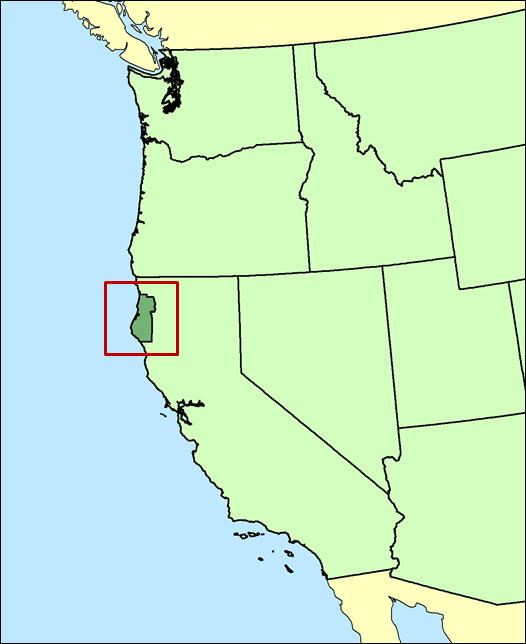
13. Now, select the "Rectangle" from the "Shapes" palette and draw a rectangle around the area of your main map. Note that these boxes will typically be a little larger than the actual area of your main map to give some "space" around the area of interest.
14. Right click on the rectangle, select "Format Picture" and give the rectangle and appropriate color. Red or a shade of red are appropriate but often you will see black used.
15. Now the locator map can be pasted into MS-Word or another package as I have done below.
Locator Maps in ArcGIS
If you have your data already in ArcGIS and want to create a locator map you can use an automatic feature in ArcGIS.
1. With your main data in the "Layers" data frame, add another "Data Frame" from the "Insert" menu.
2. Load the data described in the first section into this Data Frame and set it up as described.
3. Right click on the new "Data Frame" and select "Properties".
4. Click on the "Extent Indicators" tab.
5. This tab allows you to add a rectangle to show the extent of one layer into another layer. Select your main "Layers" data frame in the box on the left and press the arrow (">") to move it to the box on the right.
6. You should see the "Frame..." button highlight and you can press this button to change the color and size of the extent rectangle.
7. Click "OK" to see the extent rectangle appear.
8. Now you can export the maps, one at a time into your final product.
Note: Do not try to do the maps together and export them into one file. Instead, move a map onto the page, export it, and load it into an image editor to crop out what you need. Then repeat this process for your next map.