Raster Data Models
A raster dataset is the same type of image that is produced when recording an image with a digital camera. Raster data models are used to represent a wide variety of phenomena, including continuous data like surface temperature or elevation. Rasters are also used to represent thematic data (also known as discrete or categorical), which show features such as land-use or soil class data. All raster images are made up of up of thousands (or millions) of individual "picture elements" or pixels. When you zoom in on a digital image you begin to see each of the individual pixels that make up the image. In the case of aerial or satellite imagery, each of these pixels contains a number that represents the amount of light (at a particular wavelength) that was recorded by the camera and is now being displayed by the computer monitor.
Types of Raster Data
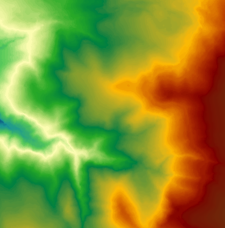
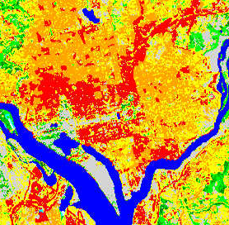
Rasters can represent a wide variety of data. The data can be continuous or categorical.
Continuous Data:

- Elevation
- Temperatures
- Precipitation
- Reflectance (light)
Categorical Data:

- Land Cover Type
- Soil Type
- Vegetation Type
Digital Numbers
The individual cell value of a raster file is known as a digital number (DN) or pixel value. The digital number or pixel value can represent a wide variety of data. This includes category/class, magnitude, height, or spectral value. Categories could represents land cover classes like forest, or developed. A magnitude might represent temperature, or precipitation. Height (or distance) could represent surface elevation above sea level (digital elevation model). Spectral values are used in satellite imagery and aerial photography to represent light reflectance and color. For example the pixel values in a digital photograph represent the amount of light that is reflected off a surface and enters the camera sensor. The intensity or amount of light for each color or wavelength at each pixel is recorded as a number. In black and white images this is generally recorded as a value between the range between 0-255. Pixels with low values appear dark, while pixels with high values are brighter. This is the default display for all raster data.

Cell values can be either positive or negative, integers, or floating point. Integer values are best used to represent categorical (discrete) data and floating-point values to represent continuous surfaces. Cells can also have a NoData value assigned to represent the absence of data in that location.
Raster File Formats
There are hundreds of different raster file formats available. Which ones you use will determine if the file can maintain a spatial reference and if the software you are using can open and process the file.
The following raster file formats are the most common and are recommended for spatial data:
- ENVI (.dat)
- Imagine (.IMG)
- TIF (GeoTIFF)
The following formats are also used for raster data in GIS because they can be spatially referenced. However, it is recommended to convert data in these formats to DAT, TIFF or IMG if you are going to use them as part of a long-term project.
- JPG
- Mr. Sid
- BIL
- BIP
- BSQ
- DEM
The following formats are generally not recommended for geospatial data:
- BMP
- PNG
- GIF
Note: Esri has indicated that they will not be supporting the "ESRI GRID" format in the future so it is not recommended.
Raster Attribute Tables
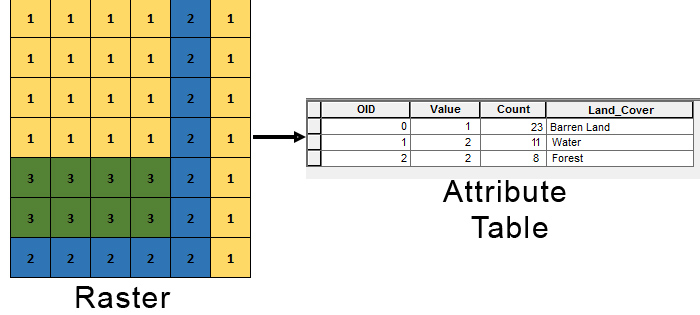
Rasters that have pixel values that represent a class or category will contain an attribute table. The pixel values of a cell often corresponds to a named class or category (for example soil type or land cover). When a raster attribute table is generated, there are three default fields created in the table: OID, VALUE, and COUNT. It is not possible to edit the content in these fields. The ObjectID (OID) is a unique, system-defined, object identifier number for each row in the table. VALUE is a list of each unique cell value in the raster datasets (in a grid, this is an integer). COUNT represents the number of cells in the raster dataset with the cell value in the VALUE column. Additional columns can be added, such as class name, codes etc. Rasters that represent continuous data generally do not have attribute tables.

Exploring Raster Data
Pixels are essentially just a digital number or value that is displayed on the monitor. A Digital Elevation Model (DEM) contains one value per pixel making it look like a "black and white photograph" or a "grayscale image". While the default is grayscale, a number of different color schemes can be used to display the same data. It is important to note that when you change the color schemes (or color ramps) in programs like ENVI or ArcGIS the original data remains unchanged. The programs simply "map" the existing data to a new or different color range. Below is a DEM of the Klamath Mountain region. The dark areas are lower elevation while the lighter areas represent higher elevation. Note: You may need to hit "Refresh" on your browser for the image to load.
