
Accuracy Metrics
There are many different ways to look at the thematic accuracy of a classification. The error matrix allows you calculate the following accuracy metrics:
- Overall Accuracy and Error
- Errors of omission
- Errors of commission
- User’s accuracy
- Producer’s accuracy
- Accuracy statistics (e.g., Kappa)
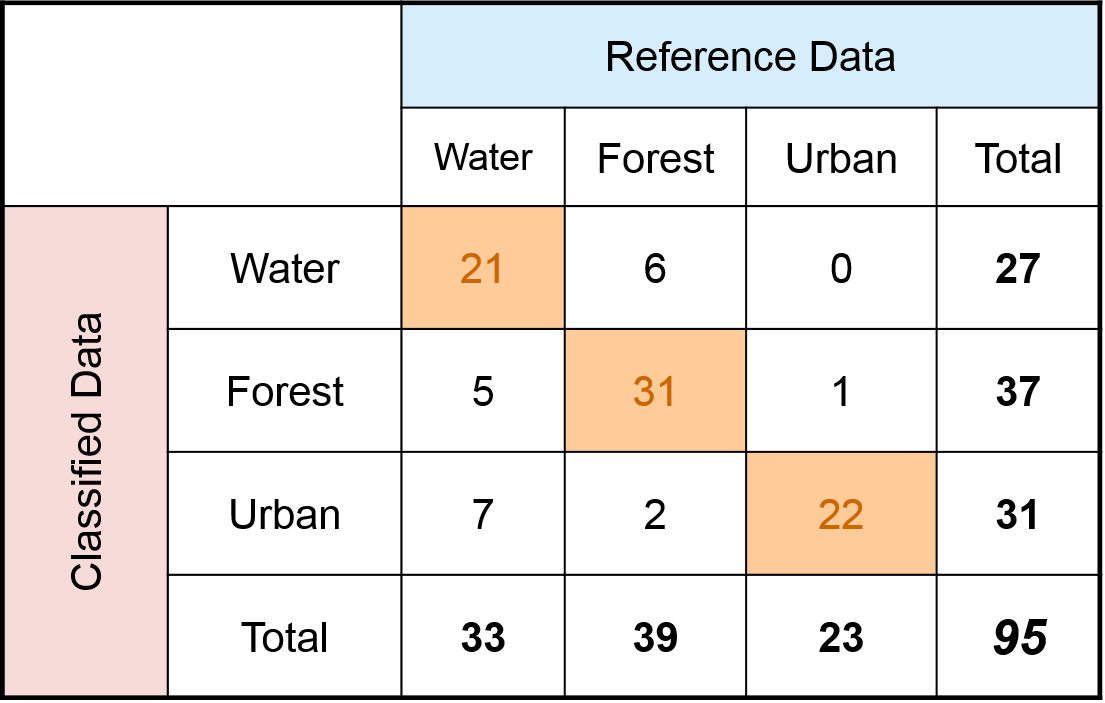
We will use the same error matrix show above to calculate the various accuracy metrics.
Overall Accuracy
Overall Accuracy is essentially tells us out of all of the reference sites what proportion were mapped correctly. The overall accuracy is usually expressed as a percent, with 100% accuracy being a perfect classification where all reference site were classified correctly. Overall accuracy is the easiest to calculate and understand but ultimately only provides the map user and producer with basic accuracy information.
The diagonal elements represent the areas that were correctly classified. To calculate the overall accuracy you add the number of correctly classified sites and divide it by the total number of reference site.
Example
based on the above error matrix:
Number of correctly classified site: 21 + 31+ 22 = 74
Total number of reference sites = 95
Overall Accuracy = 74/95 = 77.9%
We could also express this as an error percentage, which would be the complement of accuracy: error + accuracy = 100%. In the above example the error would be the number of sites incorrectly classified divided by 95 or 21/95 = error, = 22.1%. We could also determine the overall error by subtracting the accuracy percentage from 100: 100-77.9=22.1%.
Error Types
Errors of Omission
Errors of omission refer to reference sites that were left out (or omitted) from the correct class in the classified map. The real land cover type was left out or omitted from the classified map. Error of omission is sometime also referred to as a Type I error. An error of omission in one category will be counted as an error in commission in another category. Omission errors are calculated by reviewing the reference sites for incorrect classifications. This is done by going down the columns for each class and adding together the incorrect classifications and dividing them by the total number of reference sites for each class. A separate omission error is generally calculated for each class. This will allow us to evaluate the classification accuracy and error for each class.
Omission Error Example
based on the above error matrix:
Water: Incorrectly classified reference sites: 5 + 7 = 12 Total # of reference sites = 33 Omission Error = 12/33 = 36%
Forest: Incorrectly classified reference sites: 6 + 2 = 8 Total # of reference sites = 39 Omission Error = 8/39 = 20%
Water: Incorrectly classified reference sites: 0 + 1 = 1 Total # of reference sites = 23 Omission Error = 1/23 = 4%
Errors of Commission
Errors of omission are in relation to the classified results. These refer sites that are classified as to reference sites that were left out (or omitted) from the correct class in the classified map. Commission errors are calculated by reviewing the classified sites for incorrect classifications. This is done by going across the rows for each class and adding together the incorrect classifications and dividing them by the total number of classified sites for each class.
Commission Error
Example
based on the above error matrix:
Water: Incorrectly classified sites: 6 + 0 = 6 Total # of classified sites = 27 Comission Error = 6/27 = 22%
Forest: Incorrectly classified sites: 5 + 1 = 6 Total # of classified sites = 37 Comission Error = 6/37 = 16%
Water: Incorrectly classified sites: 7 + 2 = 9 Total # of classified sites = 31 Comission Error = 9/31 = 29%
Other Accuracy Metrics
Producer’s Accuracy
Producer's Accuracy is the map accuracy from the point of view of the map maker (the producer). This is how often are real features on the ground correctly shown on the classified map or the probability that a certain land cover of an area on the ground is classified as such. The Producer's Accuracy is complement of the Omission Error, Producer's Accuracy = 100%-Omission Error. It is also the number of reference sites classified accurately divided by the total number of reference sites for that class.
Producer's Accuracy
Example
based on the above error matrix:
Water: Correctly classified reference sites = 21 Total # of reference sites = 33 Producer’s Accuracy = 21/33 = 64%
Forest: Correctly classified reference sites = 31 Total # of reference sites = 39 Producer’s Accuracy = 31/39 = 80%
Water: Correctly classified reference sites = 22 Total # of reference sites = 23 Producer’s Accuracy = 22/23 =96%
User’s Accuracy
The User's Accuracy is the accuracy from the point of view of a map user, not the map maker. the User's accuracy essentially tells use how often the class on the map will actually be present on the ground. This is referred to as reliability. The User's Accuracy is complement of the Commission Error, User's Accuracy = 100%-Commission Error. The User's Accuracy is calculating by taking the total number of correct classifications for a particular class and dividing it by the row total.
User's Accuracy
Example
based on the above error matrix:
Water: Correctly classified sites = 21 Total # of classified sites = 27 User's Accuracy = 21/27 = 78%
Forest: Incorrectly classified sites = 31 Total # of classified sites = 37 User's Accuracy = 31/37 = 84%
Water: Incorrectly classified sites = 22 Total # of classified sites = 31 User's Accuracy = 22/31 = 70%
Comparing User's and Producer's Accuracy
The user and producer accuracy for any given class typically are not the same. In the above examples the producer’s accuracy for the Urban class was 96% while the user's accuracy was 71%. This means that even though 96% of the reference urban areas have been correctly identified as “urban”, only 71% percent of the areas identified as “urban” in the classification were actually urban. Water (7) and forest (2) areas were mistakenly classified as urban. By analyzing the various accuracy and error metrics we can better evaluate the analysis and classification results. Often you might have very high accuracy for certain classes, while others may have poor accuracy. The information is important so you and other users can evaluate how appropriate it is to use the classified map.
Kappa Coefficient
The Kappa Coefficient is generated from a statistical test to evaluate the accuracy of a classification. Kappa essentially evaluate how well the classification performed as compared to just randomly assigning values, i.e. did the classification do better than random. The Kappa Coefficient can range from -1 t0 1. A value of 0 indicated that the classification is no better than a random classification. A negative number indicates the classification is significantly worse than random. A value close to 1 indicates that the classification is significantly better than random.