
Error Matrix
Introduction
A Contingency Table or Error Matrix consists of an n x n array where n is the number of classes in the data. The columns always represent the reference data or the data that is known to be true or corrects. The rows are the mapped classes that were generated from the remote sensed data. The error matrix allows us to be able to calculate a variety of accuracy metrics from our data.
Error Matrix Example
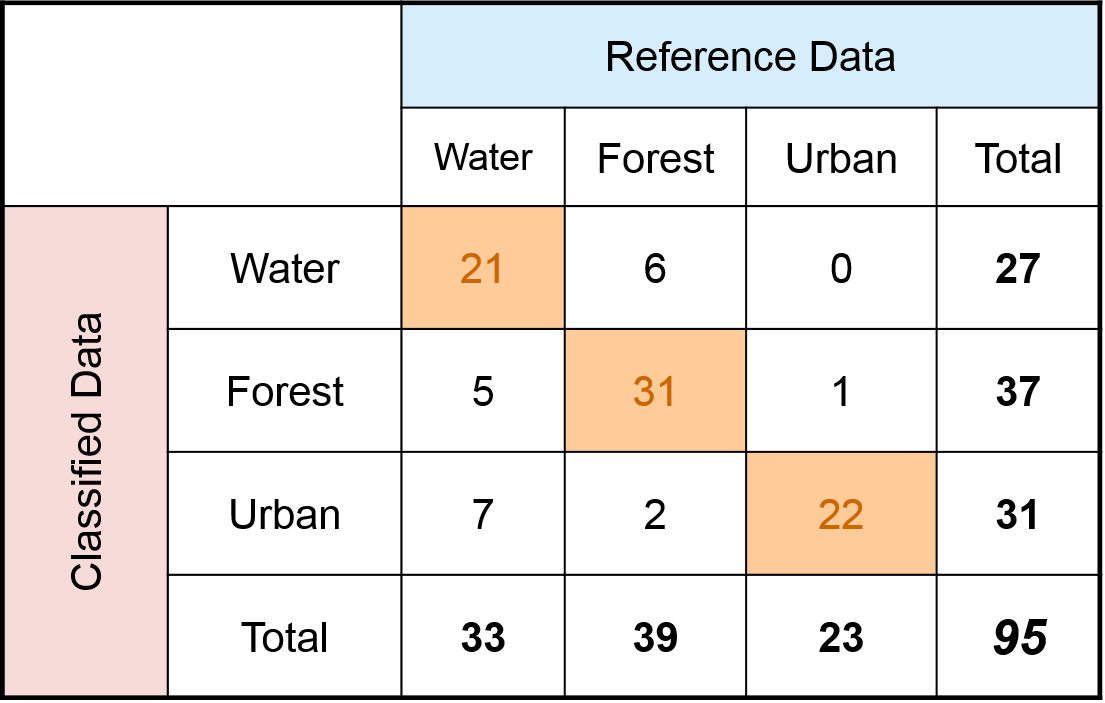
We have a classified land cover image that was created from a Landsat data set. This generated a map with three thematic land cover classes: Water, Forest and Urban. For the accuracy assessment we sampled or "ground-truthed" a total 95 reference sites in the field to verify the land cover type. Out of these reference sites, we determined that 33 were Water, 39 were Forest and 23 were Urban. These reference sites were then compared to our classified results generated from the Landsat data. Below is the error matrix generated from the example data.
Diagonal Elements
The orange highlighted diagonal elements of the error matrix represent areas that were correctly classified. These are indicative of the accuracy of our classification. In the above example, out of the 33 Water reference sites only 21 of these were correctly identified on our classified imagery. If we add up all of the diagonal elements we see that out of our 95 reference sites 74 of the site were classified correctly.
Off-Diagonal Elements
The off-diagonal elements of an error matrix represent the areas that were not classified correctly. For example, out of our 33 Water reference sites, 12 of these were classified incorrectly as either Forest or Urban. The off-diagonal elements tell us the most about how to improve our remote sensing classification and time should be spent examining these errors to determine where the most errors occurred in the classification.