Flow charts are a valuable tool to make it easier to visualize and work out complex analysis steps in spatial analysis. They also provide documentation that is easy for everyone to read and can be included in reports, posters, and papers.
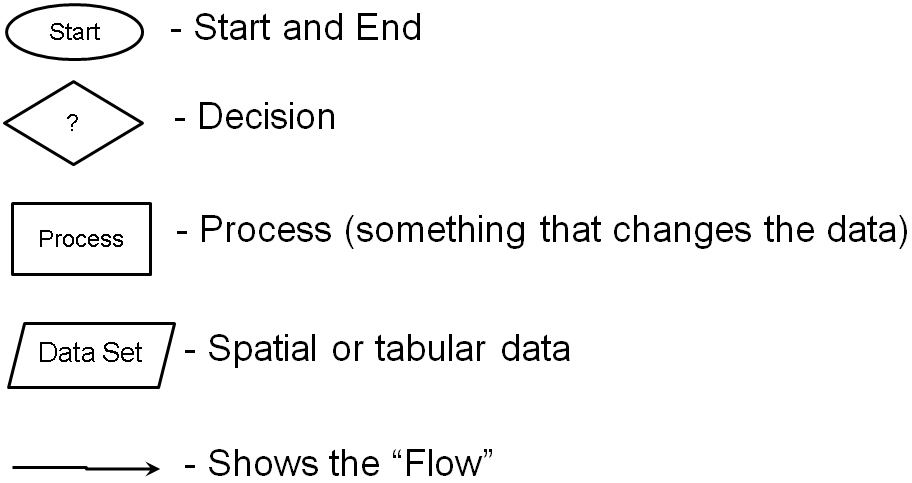
Below are the standard flow chart symbols sometimes referred to as "IBM" symbols because IBM used them extensively.
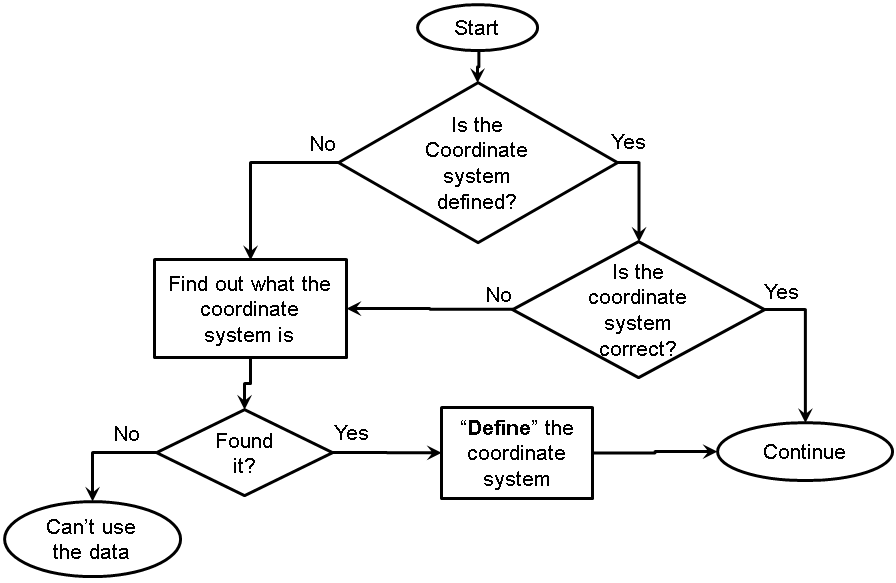
Below is an example flow chart for checking the spatial reference for a file. Follow the flow chart from start to end and see if it makes sense to you.
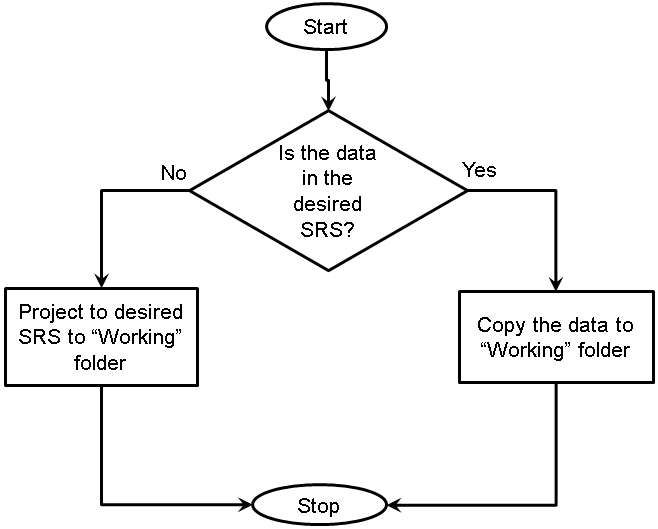
Below is another simple flow chart for checking if we need to project spatial data before we use it.
Watch the video below to see how to create flow charts in MS-PowerPoint.
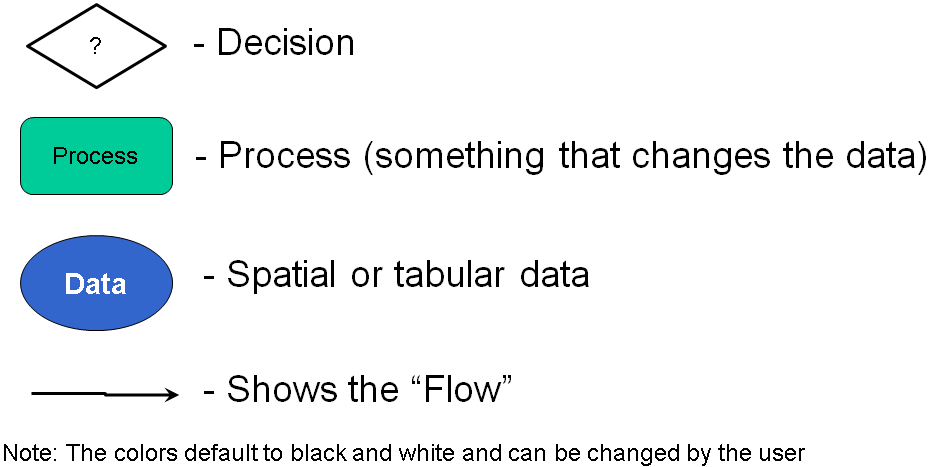
Model Builder in ArcGIS uses flow chart symbols that are a little different. It's OK if your organization uses a different set than the standard but you will need to provide a legend for nonstandard symbols.
Note: There is no "start," and "end" is really "pause."
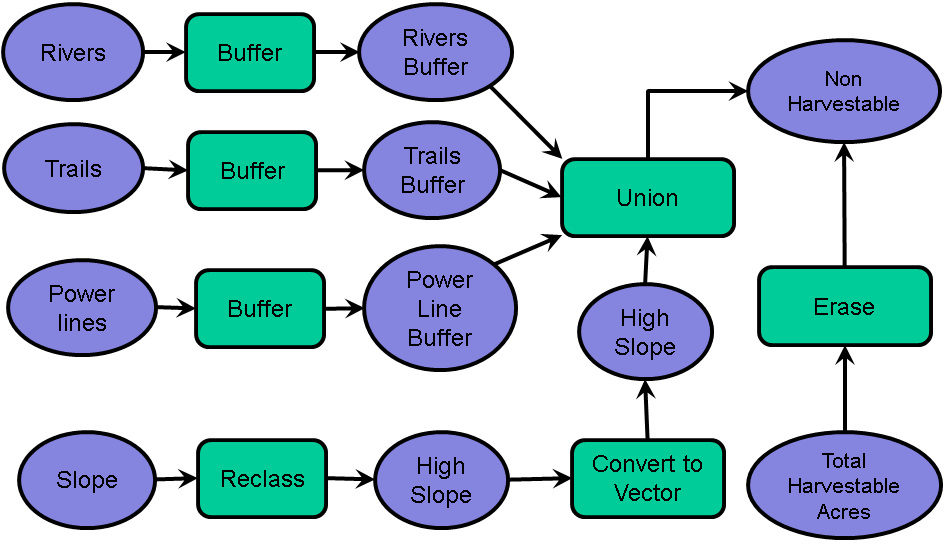
Below is an example of a model builder type flow chart for finding the area of harvestable land. Note that these are not the actual model builder symbols because model builder adds additional symbology that you cannot turn off. This makes model builder flow charts unacceptable for publication and you really need to remake them in an application like MS-PowerPoint for publication.
© Copyright 2018 HSU - All rights reserved.