Other Indices and Analysis
There are a variety of spectral indices available. We will not be able to review all indices but we will cover some of the other common indices.
Soil Adjusted Vegetation Index (SAVI)
The Soil Adjusted Vegetation Index (SAVI) is similar to NDVI but is used in areas where vegetative cover is low (< 40%). When a significant amount of the soil surface is exposed, the soil reflectance can influence the NDVI values. Light reflected from the soil can have a significant effect on NDVI values (changing the values by up to 20%)

"L" is a correction factor which ranges from 0 for very high vegetation cover to 1 for very low vegetation cover. An "L" value of 0.5 is typically used for intermediate vegetation cover, when "L" is equal to zero SAVI becomes the same equation as NDVI. The adjustment factor L was found by trial and error until a factor that gave equal vegetation index results for the dark and light soils was found.
Normalized Difference Snow Index (NDSI)
The Normalized Difference Snow Index (NDSI) is used to identify snow cover and is often used for hydrological forecasting.

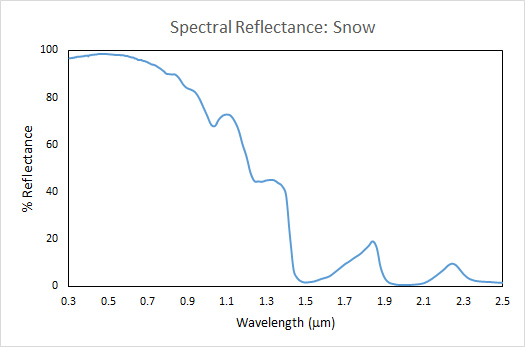
In the visible portion of the spectrum snow cover reflects highly and appears just as bright as clouds. It is therefore visually difficult to distinguish from cloud cover. However in the shortwave infrared portion of the spectrum snow reflects very little, this allows for the discrimination between snow cover and clouds. Higher NDSI values ( > 0.4) typically indicate the presence of snow, although the threshold may vary depending on the imagery and type of snow or ice.

Using Indices in Analysis
When uses indices as part of an analysis it is important to make sure data has been appropriately processed. This usually involves radiometric calibration and atmospheric correction. To get the most information out of a spectral index it is optimal to collect ground truthed data to calibrate and validate the index.
Temporal Change
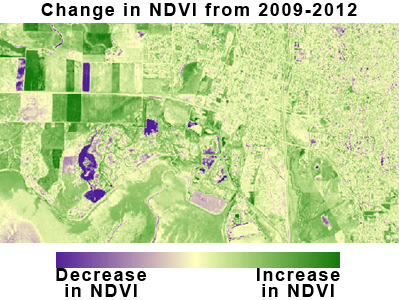
Indices like NDVI are commonly compared between multiple time periods. This allows us to analyze changes in land features of the time period. This can easily be done in ENVI and ArcGIS with the Band Math or Raster Calculator tools. These function allows us to add or subtract rasters from each other. We will learn more about this in the next module.

Classes and Thresholds
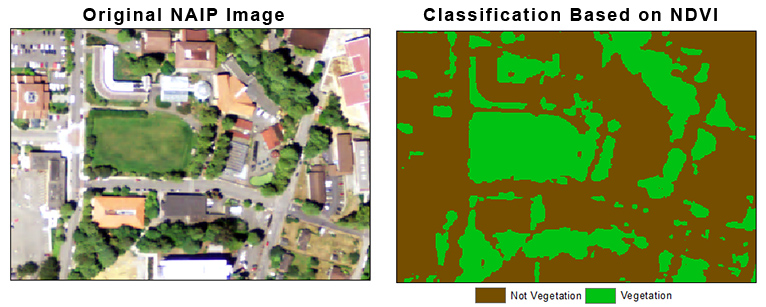
Spectral indices are also frequently used to classify land cover into different thematic classes, vegetation types or to delineate water or snow cover.
Often threshold values have been established through previous research, like in the case of the ΔNBR values and burn severity classes. Ideally ground truth samples are used to develop and validate the threshold or class values. This can also be done with high-resolution reference imagery or via other data sources.


