Normalized Burn Ratio
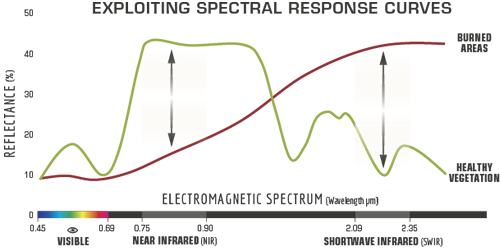
The Normalized Burn Ratio (NBR) was designed to highlight burned areas and estimate fire severity. The formula is similar to NDVI, except that it uses near-infrared (NIR) and shortwave-infrared (SWIR) wavelengths.

Pre-fire, healthy vegetation has very high near-infrared reflectance and low reflectance in the shortwave infrared portion of the spectrum. Recently burned areas on the other hand have relatively low reflectance in the near-infrared and high reflectance in the shortwave infrared band. A high NBR value generally indicates healthy vegetation while a low value indicates bare ground and recently burned areas.
 Image Credit: US Forest Service
Burn Severity
Normalized Burn Ratio is frequently used to estimate burn severity. Imagery collected before a fire will have very high near infrared band values and very low mid infrared band values and a Imagery collected over a forest after a fire will have very low near infrared band values and very high mid infrared band values. Higher dNBR indicate more severe damage. Areas with negative dNBR values may indicate increased vegetation productivity following a fire.
![]()
| ΔNBR | Burn Severity |
|---|---|
| < -0.25 | High post-fire regrowth |
| -0.25 to -0.1 | Low post-fire regrowth |
| -0.1 to +0.1 | Unburned |
| 0.1 to 0.27 | Low-severity burn |
| 0.27 to 0.44 | Moderate-low severity burn |
| 0.44 to 0.66 | Moderate-high severity burn |
| > 0.66 | High-severity burn |
The meaning of the ∆NBR values can vary by scene, and for best results interpretation in specific instances should always be based on some field assessment. However, the adjacent table from the USGS FireMon program can be useful as a first approximation for interpreting the NBR difference. These guidelines are then used to create a thematic burn severity layer depicting severity as unburned to low, low, moderate, high, and increased greenness (increased post-fire vegetation response).
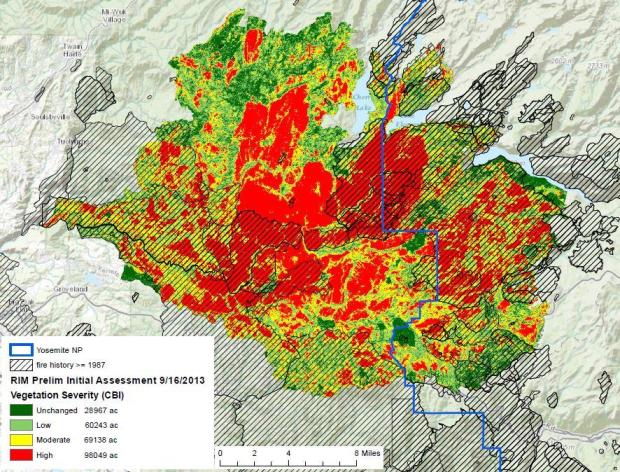
Typically, NBR and ΔNBR images are generated shortly after a fire burns to get an initial assessment of burn severity and to support field work. During the next growing season, NBR datasets are often calculated again to assess vegetation survival and delayed mortality. Burn severity data and maps can aid in developing emergency rehabilitation and restoration plan post-fire. They can be used to estimate soil burn severity and to estimate the likely future downstream impacts due to flooding, landslides, and soil erosion.
 Rim Fire Burn Severity Map
 Image Credit: US Forest Service

