Eel River UAV Tests
The following are the results of our UAV flights along the Eel River and ? The data was collected with a Phantom 4 UAV and processed with AgiSoft and BlueSpray. The videos were created with Camtasia.
Surveys
The Eel River
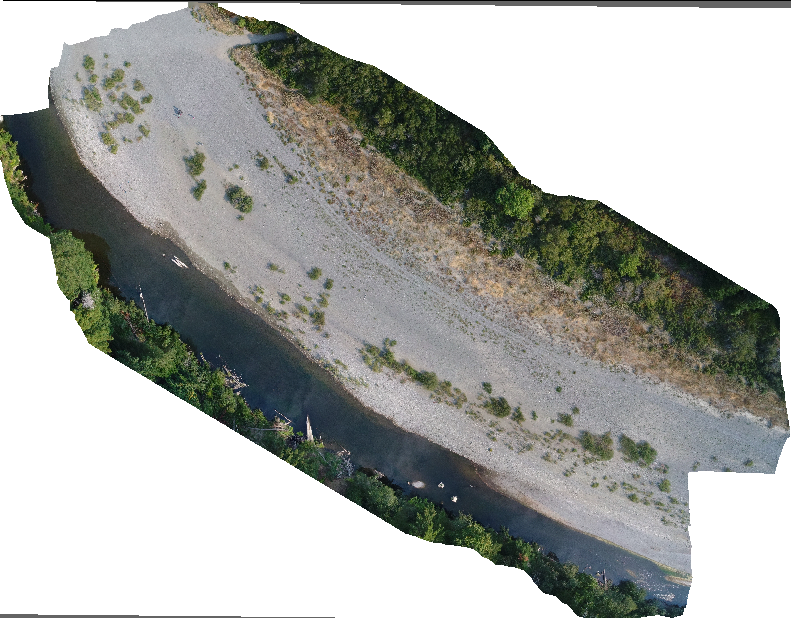
The image below is an orthomosaic created from the individual photos taken by the UAV and "stitched" together with AgiSoft. The data is from the site on the Eel River and was collected with a traditional UAV survey using the "MapsMadeEasy" control software. This image was flown at about 80 meters to avoid the trees on either side of the river. Click on the image to see the full resolution image at about 3cm. You can click on the image to see a full resolution JPG image or download an orthomosaic TIFF file here. There is also a KMZ file.
Bull Creek
Image below shows how high the canopy is over Bull Creek relatively to the width of the riparian zone.
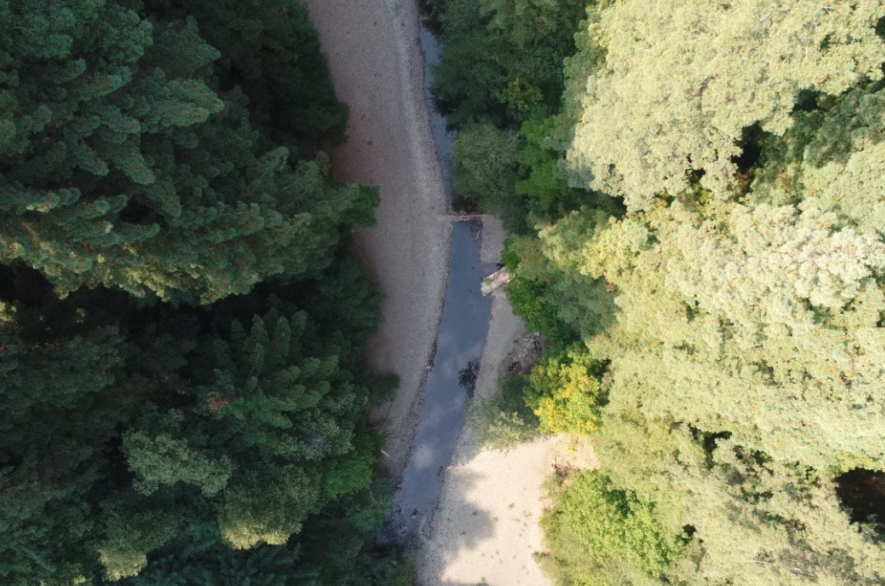
This off-angle image illustrates the problems of flying traditional UAV missions over this type of ecosystem.
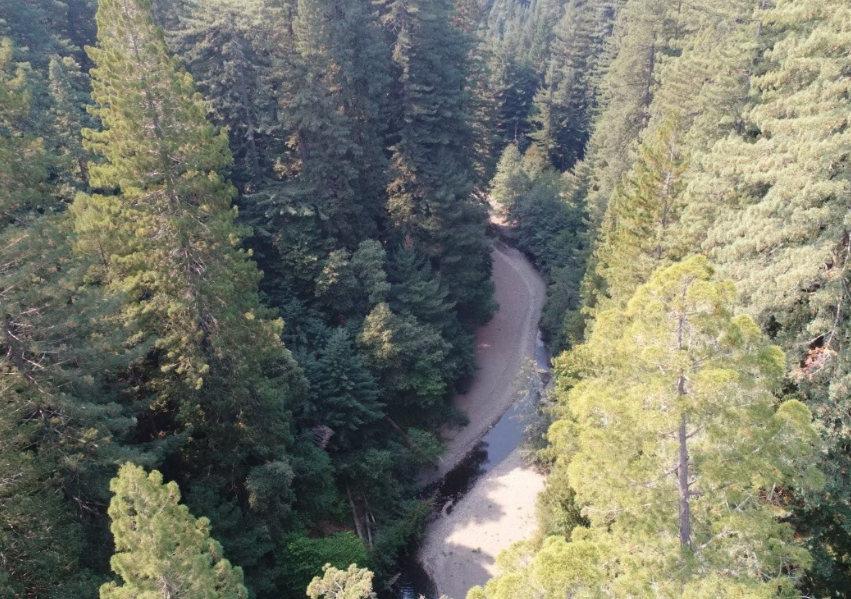
The Bull Creek site could not be surveyed with a UAV with control software because of the canopy opening being very narrow and high. Instead the site was flown manually. The height of the UAV varied between 3 and 6 meters resulting in data what is about 5cm resolution. Automating this type of flight would improve the quality of the data and reduce field time. You can click on the image below to see a more detailed view but the image is over 70o Megabytes so you may want to download it here and then view it in outside your browser. I've also created a kmz file (note that the error in the height in shown in GoogleEarth is a problem with the GoogleEarth elevation surface. I verified the UAV data is close in vertical accuracy using a 10 meter DEM shown in the next section..
The image below is from the upper left of the image above and shows the resolution that is possible with a UAV flying at low altitude.
Cow Creek
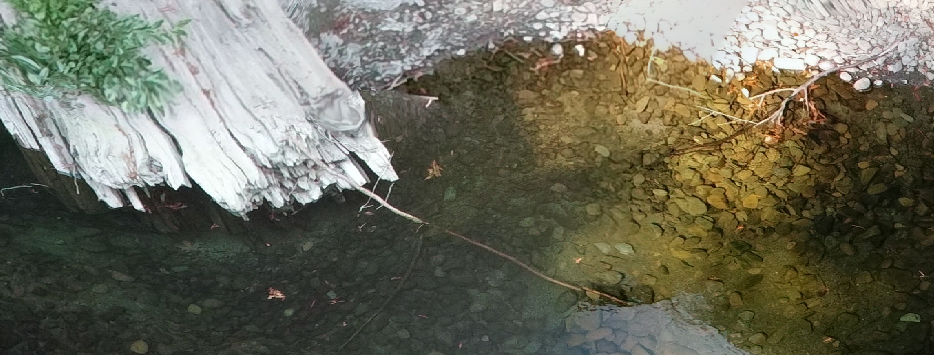
The canopy at the Cow Creek site was too dense and low to be flown with a UAV. However, this type of site could be sampled with a "Camera on a Pole" and the resulting data used to create orthomosaics.
Comparison with 10 meter DEM
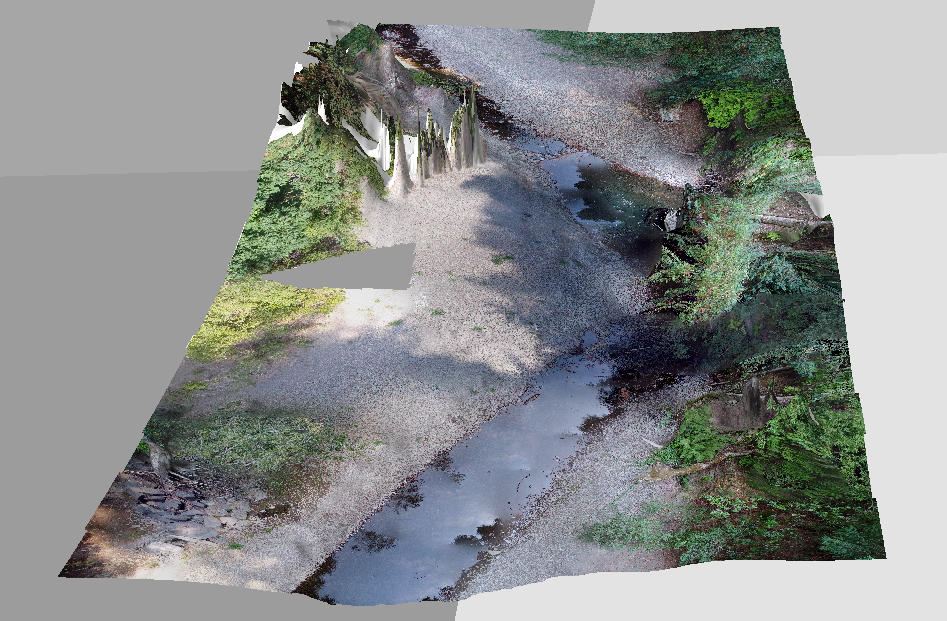
The image below shows the Bull Creek mosaic overlaid on a 10 meter DEM. The image shows that the DEM loses all of the detail of the stream bed while the mosaic captures it in very high detail. Field work should be done to evaluate the accuracy of the mosaic.
-
The image below shows the potential for finding cross-sections of streams using UAV visual data.
Other issues
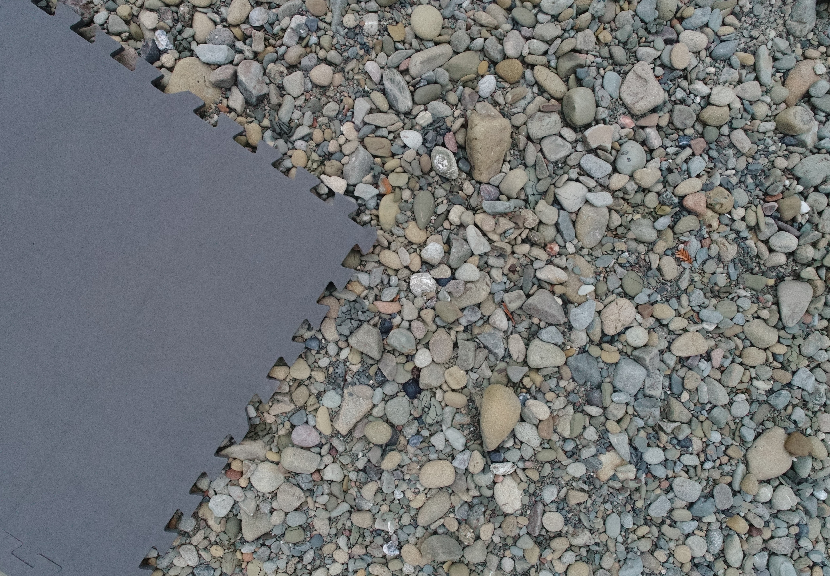
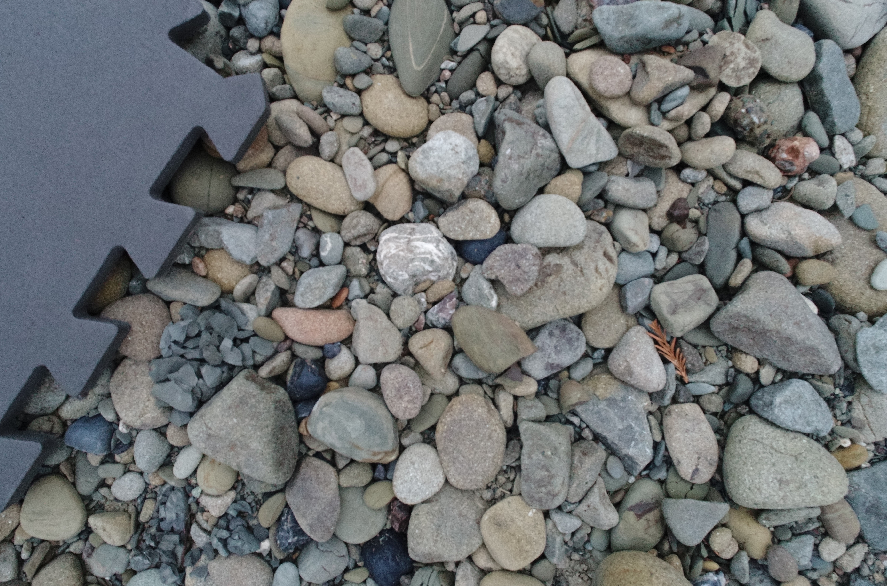
The images below show that resolution for a UAV is simply how close to the ground we fly. The closer to the ground the higher the resolution but also the longer it will take to cover an area and flying lower will increase the data size substantially. One approach would be to sample each site at high resolution but only in selected locations. This could provide quantifiable surface type data.
The distance between the ends of the fingers on the mat below is about 2.5 cm. The resolution of the image below is about 0.025cm or 0.25mm.
The resolution of this image is past the resolving power of the optics at about 0.007cm (0.07mm).
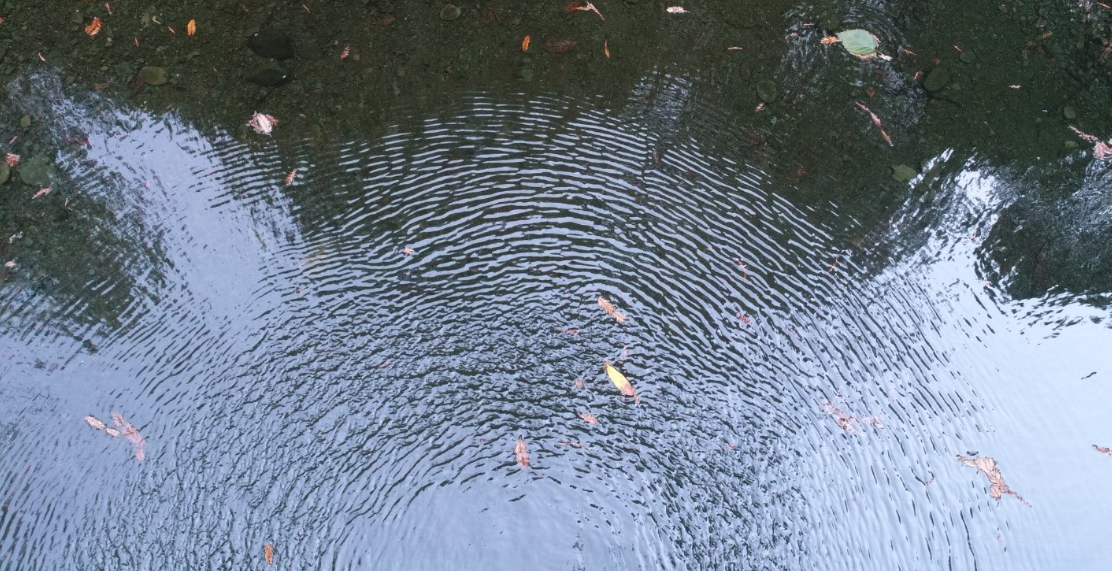
While flying over the water, I noticed that the air blowing down form the propellers, or "prop wash", was making patterns on the water if the UAV was within about 4 meters of the surface. This would need to be avoided to see into the water.
Moving shadows
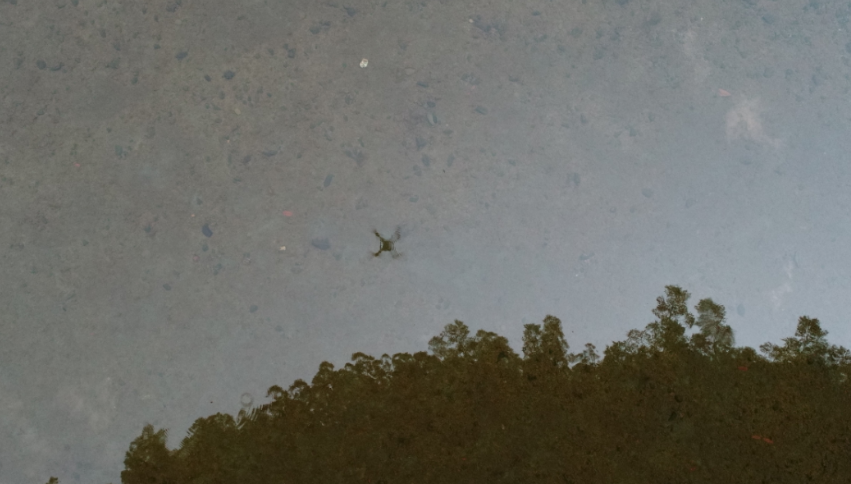
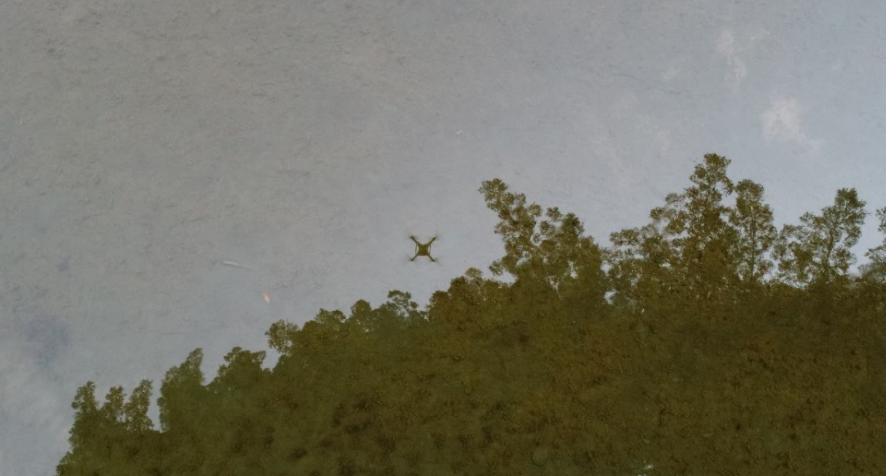
I also noticed that the shadows of the trees were moving in each image because the sun was at an angle but still illuminating part of the water. Note the distance from the shape in the upper right of the image below relative to the tree-shadow in the two images. This will cause some problems with the structure for motion software. The shadow of the UAV is not actually a problem because we take the pictures at an angle which could also help with the shadows.
For Fun
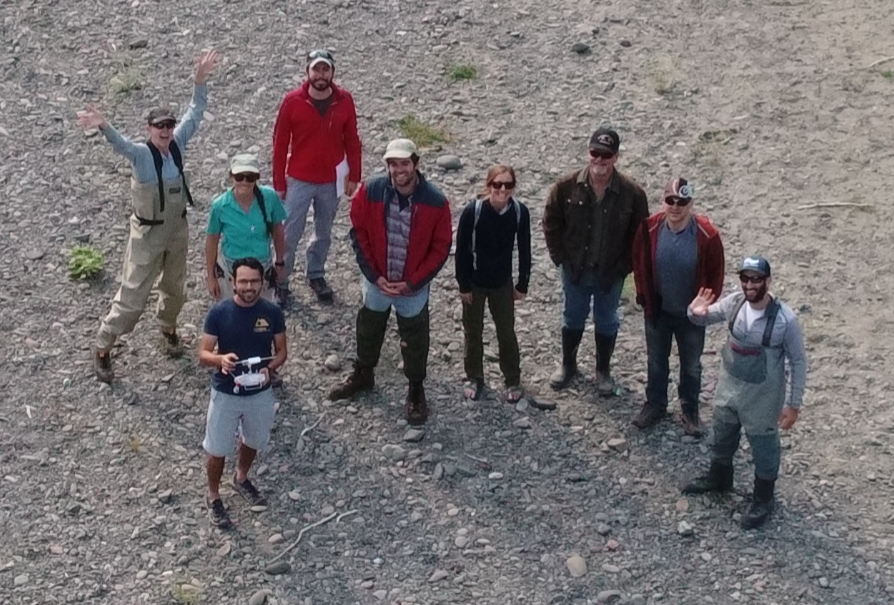
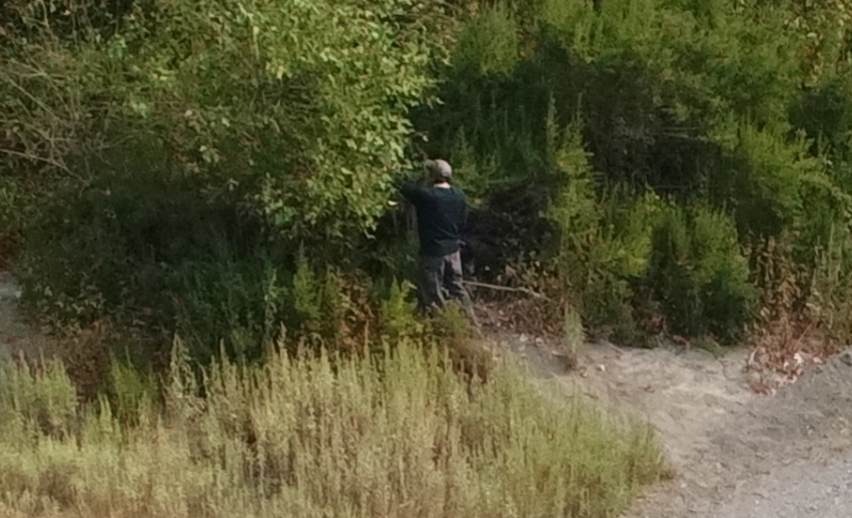
Below is the photo of the image and Bill who was off finding the bank full width.
I just liked this shot of the Eel River.
Finally, just for fun, a short video:

