Natural and False Color Composites
Sensors on earth observing satellites measure the amount of electromagnetic radiation (EMR) that is reflected or emitted from the Earth’s surface. These sensors, known as multispectral sensors, simultaneously measure data in multiple regions of the electromagnetic spectrum, including visible light, near and short wave infrared. The range of wavelengths measured by a sensor is known as a band and is commonly described by the wavelength of the energy. Bands can represent any portion of the electromagnetic spectrum, including ranges not visible to the eye, such as the infrared or ultraviolet sections.
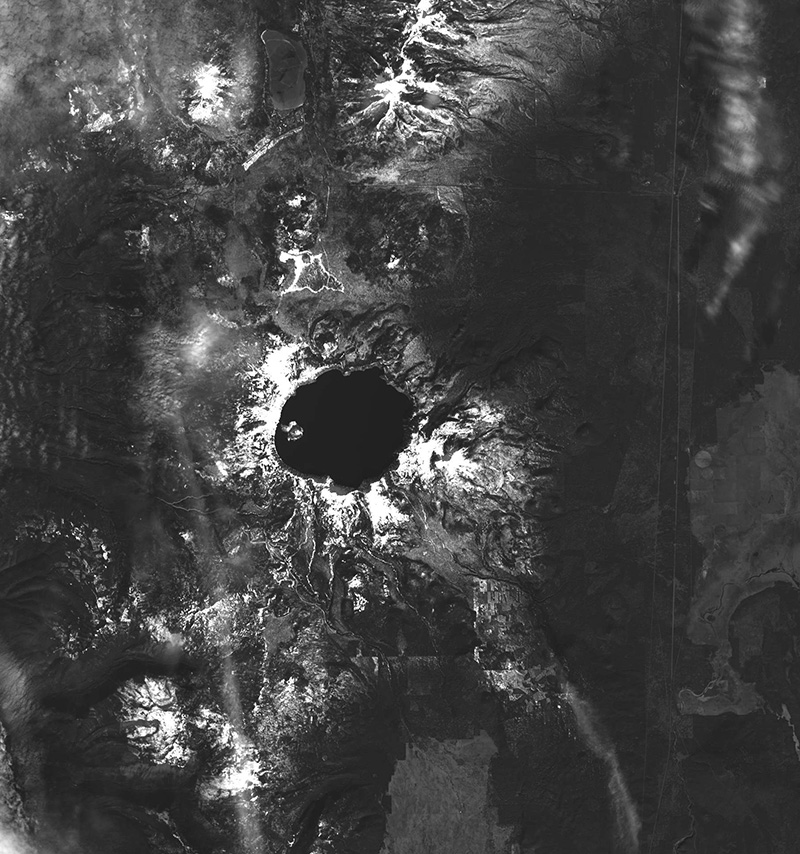
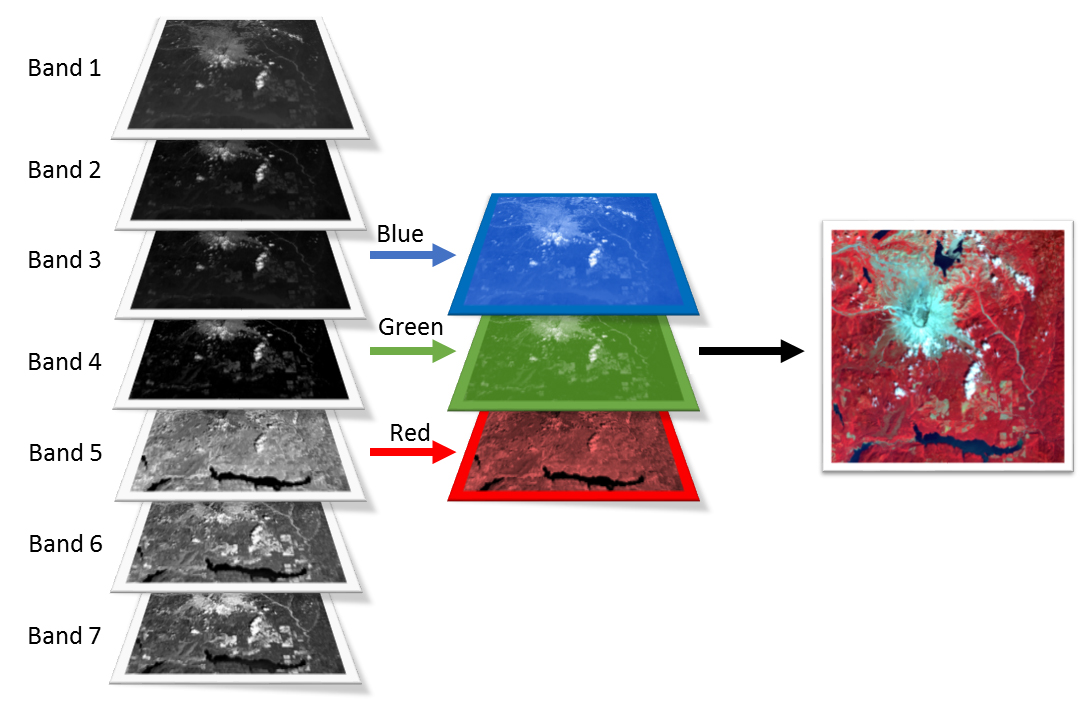
Each band of a multispectral image can be displayed one band at a time as a grey scale image, or in a combination of three bands at a time as a color composite image. The three primary colors of light are red, green, and blue. Computer screens can display an image in three different bands at a time, by using a different primary color for each band. When we combine these three images we get a color composite image.
Natural or True Color Composites
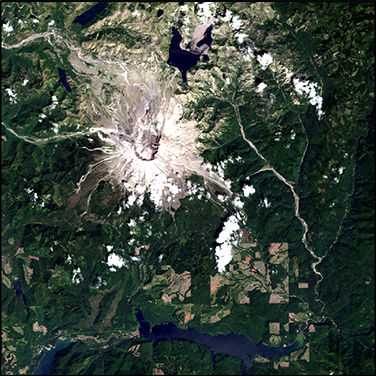
A natural or true color composite is an image displaying a combination of visible red, green and blue bands to the corresponding red, green and blue channels on the computer. The resulting composite resembles what would be observed naturally by the human eye, vegetation appears green, water dark is blue to black and bare ground and impervious surfaces appear light grey and brown. Many people prefer true color composites, as colors appear natural to our eyes, but often subtle differences in features are difficult to recognize. Natural color images can be low in contrast and somewhat hazy due the scattering of blue light by the atmosphere.
False Color Composites
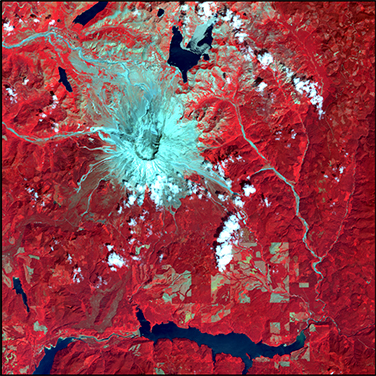
False color images are a representation of a multi-spectral image produced using bands other than visible red, green and blue as the red, green and blue components of an image display. False color composites allow us to visualize wavelengths that the human eye can not see (i.e. near-infrared). Using bands such as near infra-red increases the spectral separation and often increases the interpretability of the data. There are many different false colored composites which can highlight many different features. See the heading below for more information about common band combinations for false color composites.
Landsat 8 Reflective Bands
| Band # | Band Name | Wavelength (micrometers) |
|---|---|---|
| Band 1 | Coastal aerosol | 0.43 - 0.45 |
| Band 2 | Blue | 0.45 - 0.51 |
| Band 3 | Green | 0.53 - 0.59 |
| Band 4 | Red | 0.64 - 0.67 |
| Band 5 | Near Infrared (NIR) | 0.85 - 0.88 |
| Band 6 | Shortwave Infrared (SWIR1) | 1.57 - 1.65 |
| Band 7 | Shortwave Infrared (SWIR2) | 2.11 - 2.29 |
Landsat 8 measures different ranges of wavelengths along the electromagnetic spectrum. Each of these ranges in known as a band and in total Landsat 8 has 11 bands. The first 7 of these bands are in the visible and infrared part of the spectrum and are commonly known as the "reflective bands" and are captured by the Operational Land Imager (OLI) on board Landsat 8. In addition to the 7 bands listed in the table to the right, there is also a panchromatic or black-and-white band (Band 8) and a cirrus cloud band (Band 9) that is used to detect cirrus clouds. Landsat 8 also has a Thermal Infrared Sensor (TIRS) which collects data in two thermal infrared bands. Read more about Landsat 8 Bands
Band Combinations for Landsat 8
| Natural Color | 4 3 2 |
| False Color (urban) | 7 6 4 |
| Color Infrared (vegetation) | 5 4 3 |
| Agriculture | 6 5 2 |
| Healthy Vegetation | 5 6 2 |
| Land/Water | 5 6 4 |
| Natural With Atmospheric Removal | 7 5 3 |
| Shortwave Infrared | 7 5 4 |
| Vegetation Analysis | 6 5 4 |
Band combinations are selected for a number of reasons and it is helpful to understand the spectral reflectance profiles of features you are interested in studying. For example in the NIR false color composite shown above healthy vegetation appears bright red as they reflect more near infrared than green. Another common combination uses the shortwave infrared (shown as red), the near infrared (green), and the green visible band (shown as blue). In this false color composite vegetation appear bright green, bare ground appears reddish and snow appears bright blue. Though there are many possible combinations of wavelength bands, the table to the left is a list of some that are commonly used. The band combinations are listed by band number in order of red, green, blue (RGB):
Exploring Band Combinations
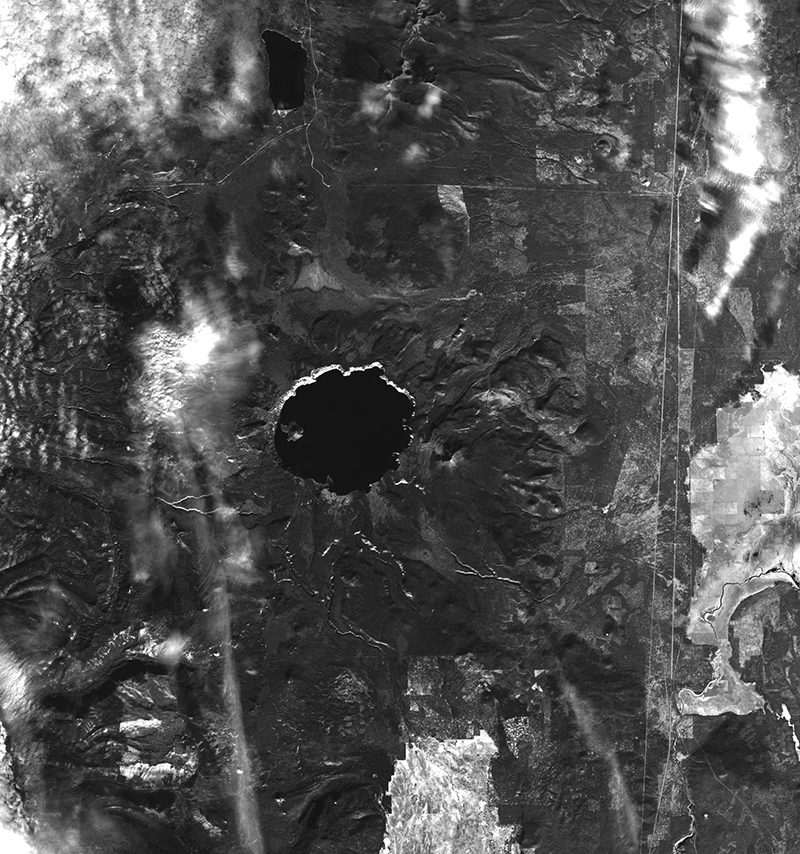
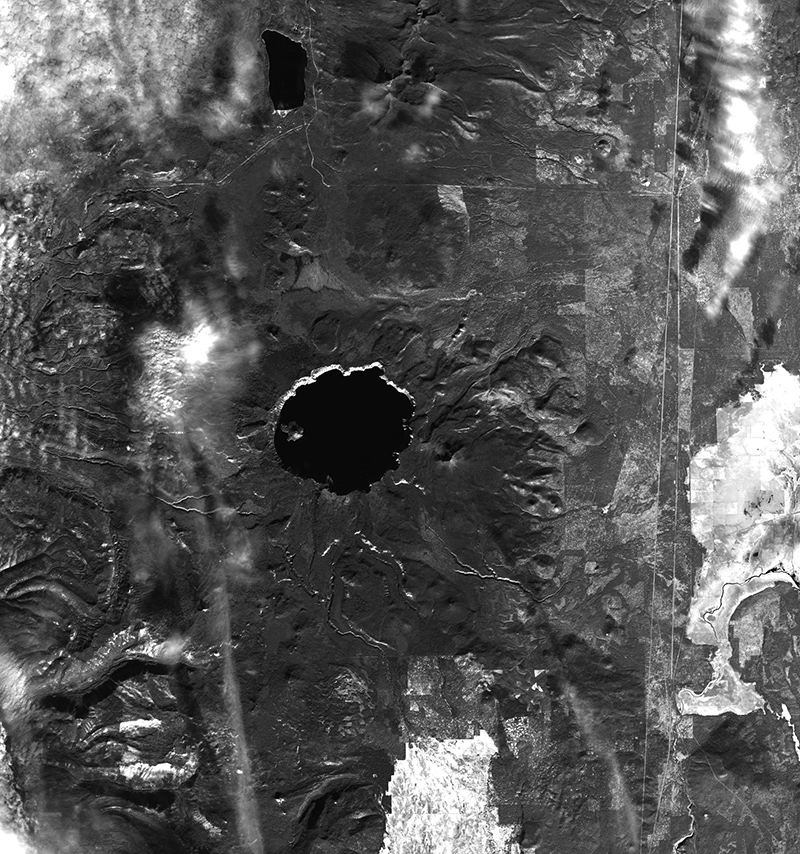
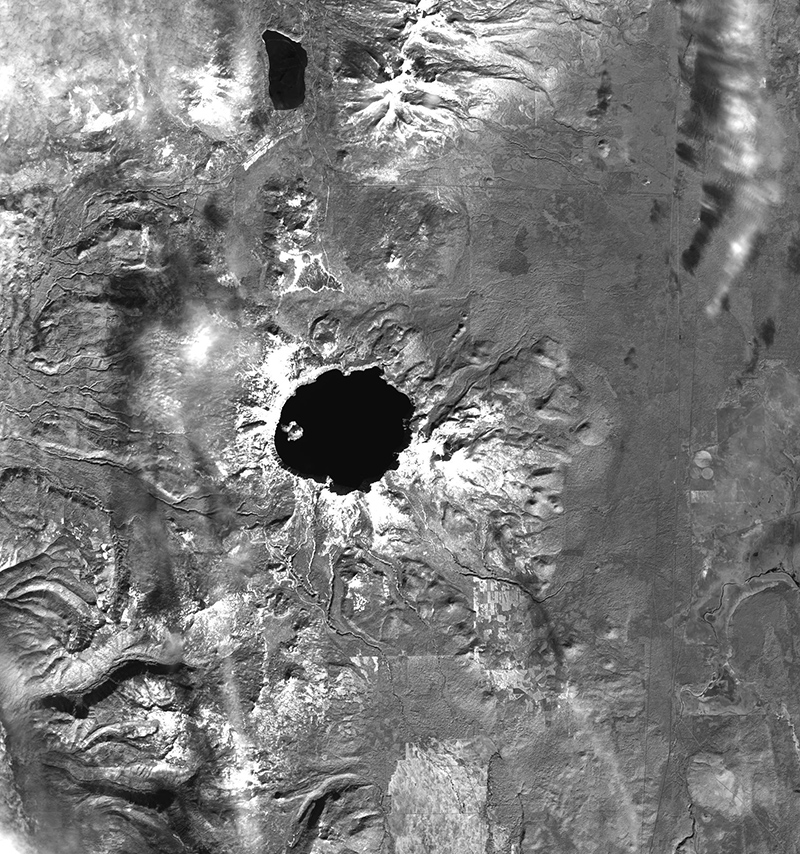
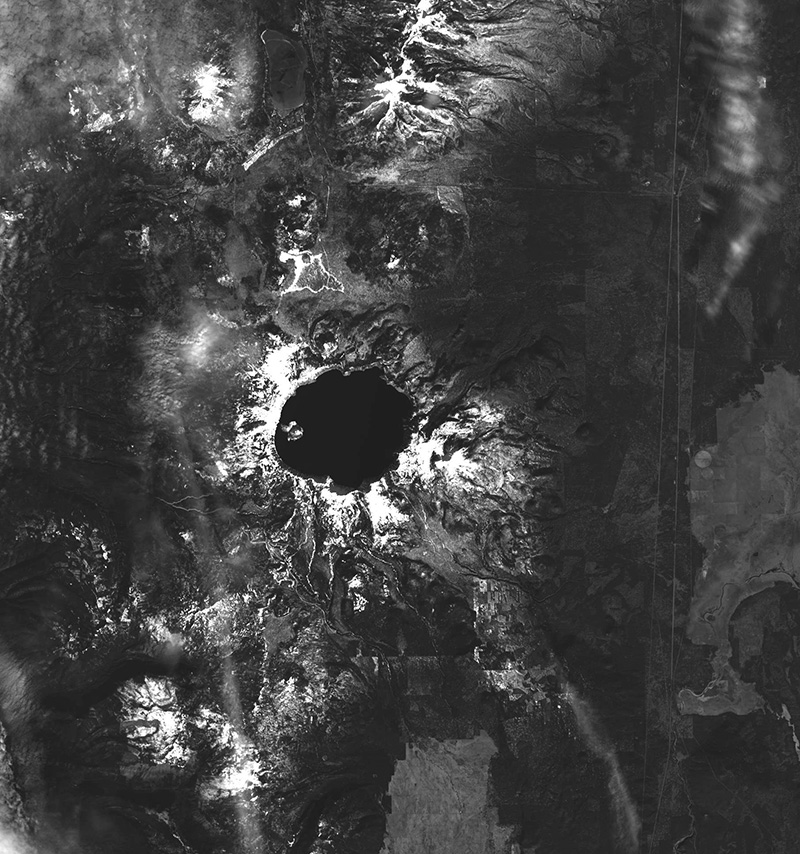
You can explore the way different band combinations highlight different features by using the interactive tool below. Try some of the band combinations listed above and see how various land features look. The below image is focused on Crater Lake National Park in southwestern Oregon. The image was acquired by Landsat 8 in March 2014.
Red: Green: Blue: