Fun with Projections
Introduction
There are many different projection methods but how do you decide which ones to use? Then, how do you set the settings for a projection method to be the best for your area of interest? This lab will let you explore projections and their settings and evaluate the error associated with projection methods.
Learning Outcomes
- Articulate the advantages of different projections
- Articulate types of error: area, form, distance
- Create tables using MS-Word
- Articulate the impact of different projections on uncertainty
Walk Through: Using BlueSpray
BlueSpray is a GIS program that was created by Jim Graham and it contains a powerful tool to help visualize the error associated with projections.
Note: The video shows downloading the Oracle version of Java but CPH is now using the Amazon Corretto version 24. To install Corretto 24, go to the downloads page and select the Windows X64 msi installer for MS-Windows or one of the Linux x64 installers for Mac or Linux (I'm not sure which one). For Windows, just double click on the msi to install Corretto. Note that Chrome is blocking download of some files at CPH so you may need to use Edge.
- Open BlueSpray which should be located with other "GIS" applications on your computer. If not, you can download the latest version of BlueSpray from the SchoonerTurtles web site (www.schoonerturtles.com). When you run BlueSpray, if it asks for a "passcode", use "Leatherback".
- Go to "Utilities -> Projection Explorer". A dialog should appear with a number of controls.
- Uncheck the check boxes in the lower left of the dialog labeled "Allow distances from", "Allow areas from", and "Allow Angles from 0 to:".
- Press "Update" at the bottom of the dialog and an image like the one below should appear.
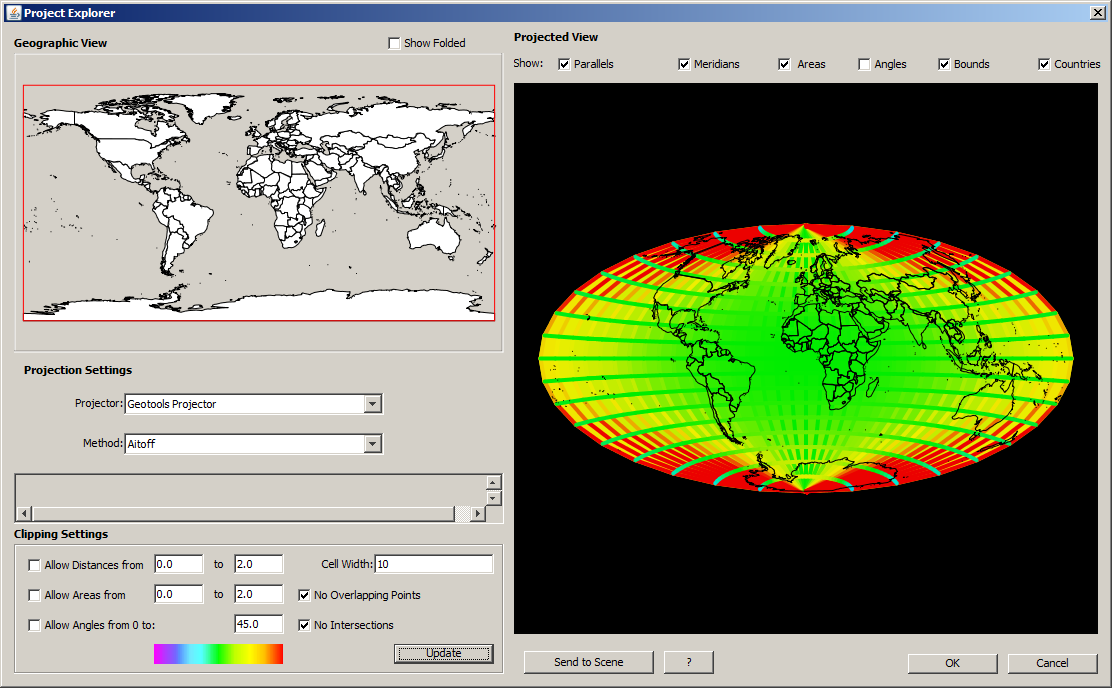
- Click on the button with a question mark ("?") at the bottom of the dialog to see help on the various elements within the dialog.
To watch a large version download the MP4 version.
Walk Through: Visualizing Distortion
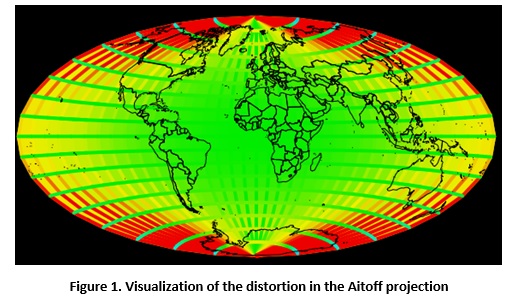
Take a look at the image on the right of the dialog. The areas that appear red indicate locations where the spatial data has been stretched (high distortion) while the green areas indicate minimal distortion and purple indicates area where spatial data has been compressed (also high distortion). The limits of "high" and "low" are set in the controls in the lower left where it shows "Allow Distances from", "Allow Areas from", and "Allow Angles from 0 to."
- To understand this better, select "Mercator 1SP" from the "Method" pop-up on the left and click "Update"
- Take a moment and examine the distortion in the panel on the right. You can turn the symbols for the different types of distortion on and off with the check boxes above the image. Red indicates a lot of distortion while green indicates minimal distortion.
- Parallels: Colors lines of latitude to show how they have been compressed or stretched in their length (distance distortion)
- Meridians: Colors lines of longitude to show how they have been compressed to stretched in their length (distance distortion)
- Areas: Colors areas to show how their area has been stretched or compressed (area distortion)
- Angles: Displays colored dots to indicate how angles have been changed from 90 degrees.
- This shows how projections, like Mercator, can greatly exaggerate the area of different locations on the earth. The "Web Mercator" or "Google Mercator" projection used by GoogleMaps is based on Mercator and greatly distorts the area of different regions of the world.
- In the panel in the lower left you'll see there is a control for "Cell Width". This changes the size of the cells in the grid of pixels used to compute the distortion. Change it to 3 and you'll see more lines appear in the image. This shows you more detail but will also slow down the updating process. We'll need to leave it at 3 for the next exercise but typically you can change it to 10 to have faster updates.
- In the same panel, check the box for "Allow Areas from", make sure the values are set to "0 to 2", and click Update. This will limit the distortion that is allowed. You should now see a much smaller area and all the cells in the grid that is overlaid on the map will have areas that are from 0 to twice (2 times) the correct area.
- Bring up a browser and navigate to EarthExplorer.
- Zoom out in EarthExplorer as far as you can and then pan down so you can see Antarctica. If you can't see Antarctica very well, try resizing your browser window and pan down again.
- Now, in BlueSpray, make sure that "Allow Distances from" is unchecked then set the "Allow Areas from" "to" value until you can see the same area as in EarthExplorer (hint: it is between 50 and 200).
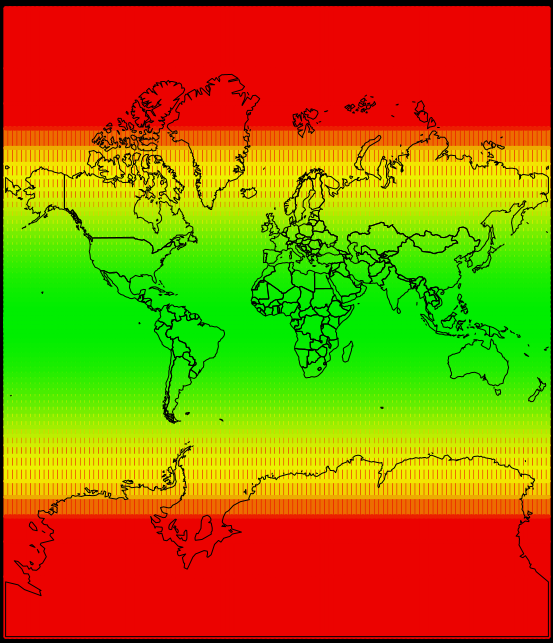
Countries of the world projected using Mercator with no limits on distortion. Note how Antarctica is stretched out to the bottom of the projection.
Question 1: Approximately, what is the maximum distortion in EarthExplorer?
Note: As of the summer of 2018, GoogleMaps changes to a 3D view when you zoom out so you cannot see the full distortion from Google Mercator. Because of this, I changed the website to EarthExplorer.
Now let's take a look at some other popular projection methods. "Albers Equal Area" is a projection that attempts to maintain areas while letting the distances be distorted.
- Switch the "Method" to "Albers Conic Equal Area." and press "Update".
- Make sure "Areas" is checked and uncheck "Parallels", "Meridians", and "Angles" and press "Update".
- The entire earth should be green. This is because this projection method maintains "equal area" anywhere on the earth.
- Uncheck "Areas" and check "Angles." This projection also maintains the "shape" of polygons.
- Now, uncheck "Angles" and check "Parallels" and "Meridians."
Question 2: Where have the parallels been compressed or stretched in the Albers Equal Area projection?
Question 3: Where have the meridians been compressed or stretched in the Albers Equal Area projection?
Universal Transverse Mercator (UTM) is one of the most popular projection systems. Let's see how it performs.
- Select "Transverse Mercator" for the "Method"
- Uncheck all the "Allow" check boxes.
- Click "Update"
- Don't worry, what has happened is that the Transverse Mercator projection gets a little weird if you do not limit its distortion.
- Check the "Allow Areas" distortion and set it to be from 0 to 2
- Click "Update".
- Check all the types of distortion above the image and you'll see that Transverse Mercator performs very well for a "slice" of the earth.
- Change the area distortion to be from 0 to 1.1 and press "Update"
- The area of the earth that is within the bounds has shrunk but still there is a large area that is within the desired distortion.
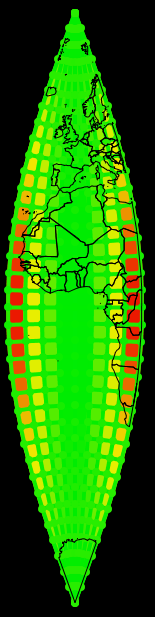
Transverse Mercator Projection with Area Distortion limited from 0 to 2
We can also change the settings for a projection.
- With "Transverse Mercator" selected as the "Method", take a look at the "Projection Settings" in the scrollable panel. These are settings that are specifically for "Transverse Mercator" and you'll see them change when you change the projection method.
- Change the "Longitude of Origin" to -120 and press "Update". You'll see the image change to be centered over the western US. You have now created the basic settings for the UTM Zone 10 North projection that is commonly used in Northern California.
Skill Drill: Quantifying Distortion
In the next series of steps you will create a table in Microsoft Word and fill in the values for the distortion for four different projections of your choice. The table shown below is an example of the table you should create in Word. For each of the four projections you choose, enter the distortion value for parallels, meridians, area, and angle (conformal). In addition you will take a screen shot of each of your projections to include in the report as figure with a caption. An example of what this should look like can also be seen below.
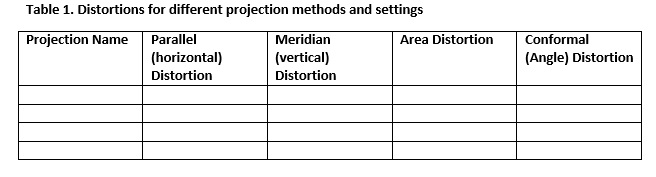
An example of the table you should create in Microsoft Word
An example of a screen capture of a projection. You should have four of these and can crop them down using MS-Word
Note: The "Longitude Rotation" projection method does not actually project, it just rotates the geographic data. It is not appropriate for this lab.
- While in the Projection Explorer, choose a projection and take a screen capture by:
- holding down "Alt" and pressing "Print Screen" at the same time, or
- launching the Snipping Tool and snip the area of interest
- Copy and paste the image into a Microsoft Word document.
- Note that typically we do not use screen shots in reports because the resolution is too low. However, for this lab, screen shots are OK.
- In BlueSpray, try and center your chosen projection on your island from the first lab by changing the "Longitude of Origin"
- Make sure all the check boxes along the top are checked. Select "Send to Scene" at the bottom panel and then close the Projection Explorer by clicking the close box in the upper right corner. You'll see layers for each of the types of distortion display in a very similar way to ArcMap.
- Look at the project tree on the left side of BlueSpray's main window and you'll see layers for the "Horizontal Distance", "Vertical Distance", "Conformal", and "Areas" data.
- Click on the "eye" next to each layer. It will change to make the layer invisible. You can also click again to make a layer visible.
- Make all the layers invisible now except the "Areas" layer.
- Click the "I" button in the tool bar at the top of the BlueSpray window and then click on the earth near where your island was created. A window should appear showing the attributes for that feature.
- Look for the "Distortion" attribute and note it's value in your MS-Word table. This is the distortion at that point on the globe for the projection you selected. The distortion for areas and distances is computed by dividing the projected value by the original value (i.e. ProjectedValue/OriginalValue). Thus a distortion of 1 would be perfect, 0.5 would indicate the value was shrunk to 1/2 and 2 would indicate the area or distance has been increased by a factor of two.
- For the "Conformal" values the distortion is the change in angle from the expected angle of 90 degrees.
- Repeat this process for the "Horizontal Distance", "Vertical Distance", and "Conformal" (shape) layers.
Note: If you get a value of 0, you may need to zoom in further and click on the nearest parallel for horizontal values, click on the nearest meridian for vertical values, or click on the nearest angle (dots) for conformal distortion.
- When done with the scene, you'll want to right click on it and "Remove" it. If you do not, it can become confusing rather quickly.
- Relaunch the Projection Explorer and repeat steps 29-39 three more times, choosing a different projection each time.
Additional Resources
Jim’s page on selecting projections
Flex Projector for selecting projections
Geocart for investigating various projections
USGS Poster on Map Projections
Wikipage on Tissot’s indicatrix
Hunter College web page on Choosing a Projection
An Icoasahedron Projection You can Print and Fold into A Model of the Earth