Terrain Analysis - Planning a Homestead
Introduction
You've just been notified that your long lost and very wealthy uncle has died, and left you his fortune. You can finally purchase the property of your dreams and begin building the homestead you've been talking about for years. You've got the plans, friends to help, and now all you need is to find the perfect location to get started. You want to have a small farm on the property so you'll need a south-facing piece of land with a gentle slope.
The task for this lab is to find the largest south-facing, gently sloping, piece of land around Arcata.
Learning Outcomes
- Export to new file formats
- Mosaic to new raster
- Raster calculator
- Surface analyst tools (aspect, slope, and viewshed)
- Raster to polygon tool
Data
DEMs for Arcata
These are DEMs in the new Spatial Data Transfer Standard (SDTS) file format that have been downloaded from the GeoComm website. They are in exactly the same form as from the website and you're welcome to download them from there if desired.
Walk Through: Workspace Preparation
- Set up your workspace/folder structure. Remember the file and folder name restrictions we warned you about in Lab 9
- Download the data and unzip to your originals folder in your workspace
The extension "tar.gz" means the file is a compressed tar archive. You will need to first unzip the "gz" files and then unzip the "tar" files.
Walk Through: Exporting to a New File Format
We will convert the files to a format that is easier to work with in ArcMap.
- In ArcMap, open the ArcCatalog window
- In ArcCatalog, navigate to your "Originals" folder
- Create a new folder within your "Originals" folder, and name it "DEMs"
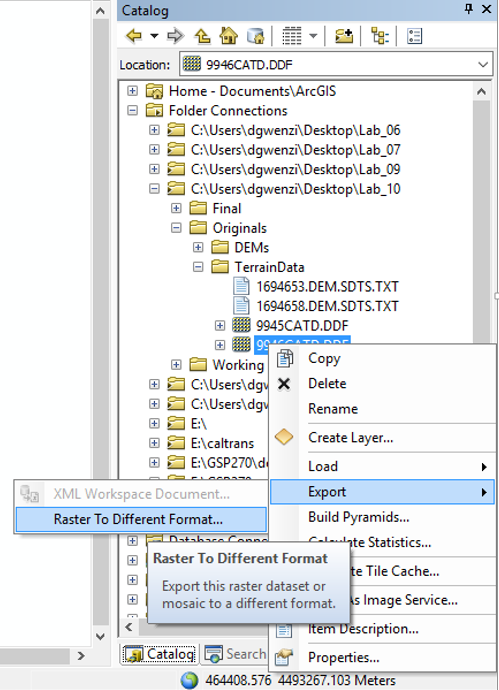
- Right-click on the file "9945CATD.DDF" and select "Export" → "Raster To Different Format..."
- In the "Copy Raster" window that appears, save your output file in the "DEMs" folder you just created. Name the file "arcataNorth.img" to save it as an Erdas IMAGINE file.
Make sure you specify the file extension IMG. If you do not, ArcMap will default to saving it as a GRID file. Keep this in mind every time you generate a new file in your analysis.
- Repeat this process for the file named "9946CATD.DFF" and call the output "arcataSouth.img"
- Verify both of your new IMG files were added to your Table of Contents.
- Check out your data. Each DEM has a "readme" or other associated text file(s) that will indicate the vertical units. In ArcMap, check your layer properties to see if there is a spatial reference defined.
Question 1: What is the resolution of the files?
Question 2: What is the spatial reference associated with the files?
Question 3: What is the "Pixel Type" and what is the "Pixel Depth" for the files?
Skill Drill 2: Creating a Mosaic
We currently have two DEMs, but it will be easier to work with them if we merge them into a single file. This function is referred to as creating a "mosaic."
- Project each of your rasters into the spatial reference we will be using for the rest of the lab (NAD 83, UTM Zone 10 North) and save them to your "Working" folder
- If you are having difficulty, refer back to the lab on projections (lab 2).
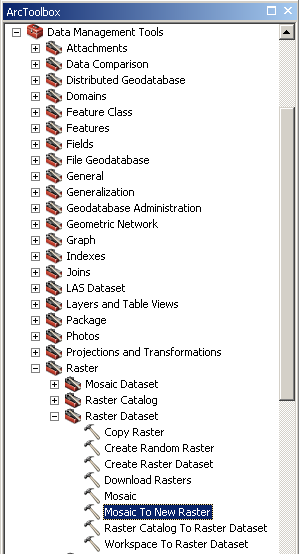
- From ArcToolbox, select "Data Management Tools" → "Raster" → "Raster Dataset" → Mosaic to New Raster
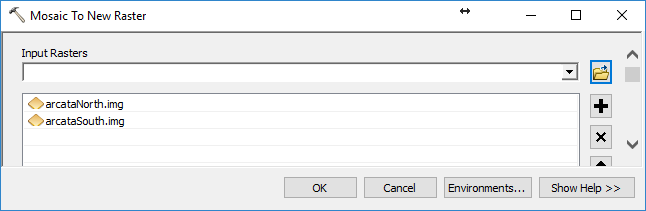
- Add both of the DEMs as the "Input Rasters" in the "Mosaic to New Raster" dialog window (Use the pull down menu to select/add the rasters)
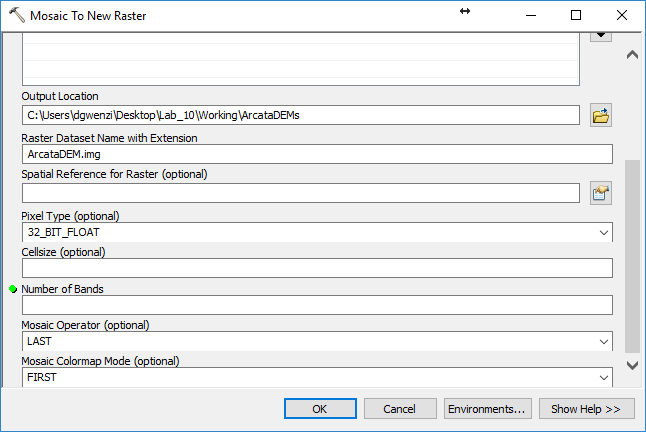
- Click on the "Browse" button to the right of the "Output Location" and create a new folder named "ArcataDEMs" in your "Working" workspace folder, as this data is for the Arcata area.
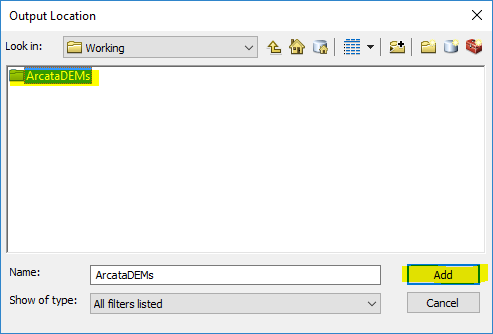
- Select the new "ArcataDEMs" folder and then select "Add"
- In the "Raster Dataset Name with Extension" text field, type "ArcataDEM.img"
- The spatial reference is optional because ArcMap will use the values from the existing rasters unless you specify a new one, so leave this blank
- Most DEMs contain integer values, but if you look at the legend, you'll see that these contain digits after the decimal. This means we'll want to use a floating point "Pixel Type" to maintain the full range of values in the DEM
- Set the "Pixel Type" to "32_BIT_Float". (64_BIT is for double floating point values and will also work, but makes the image twice as large, so use 32_BIT for this lab)
Warning: If you do not set the "Pixel Type," ArcMap will use the default value of "8_BIT_Unsigned" which will only allow values from 0-255.
- "Cell Size" is optional because ArcMap will use the values from the existing rasters unless we specify new ones, so leave this blank
- In the "Number of Bands" text field, enter "1"
- The "Mosaic Operator" determines how ArcMap combines raster data when they overlap. This is not critical for these datasets, so leave it as the default setting.
- These rasters do not have color maps, so you can click "OK." Your tool window should look like the one below:
Using the mosaic tool on these rasters will not take long. For larger files, mosaicing can take a very long time (sometimes days).
- Enable the Spatial Analyst Extension or you will get the following error
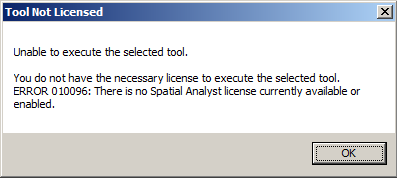
- Select "Customize" → "Extensions" →; Make sure the "Spatial Analyst" box is checked
Walk Through: Creating a Slope Raster
The pixels in a "slope" raster contain values that indicate how steep a slope is at that pixel. This can be used to determine where people and many plants prefer to live. This is a great way to determine the best place for a thriving homestead with plenty of space for a large dwelling and farm.
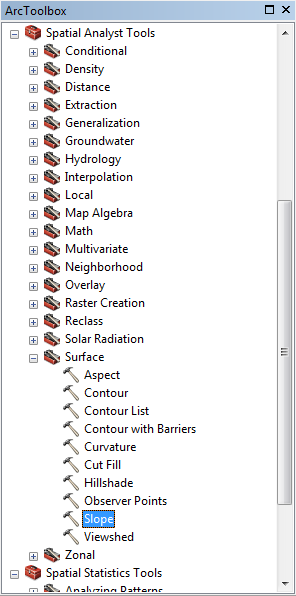
- From ArcToolbox, select "Spatial Analysis Tools" → "Surface" → Slope
- Set the "Input Raster" to be your "ArcataDEM"
- Save the "Output" raster to your working folder and name it "Slope.img"
- The "Output Measurement" is a very important parameter that is often set incorrectly. Slope can either be in degrees (0-90) or in percent (0 to infinity). These are very different ranges of values. Leave the value at "DEGREE" for this assignment.
- The "Z factor" should be 1 because the horizontal and vertical units are both in the same unit (meters). Your dialog window should look like the one below:
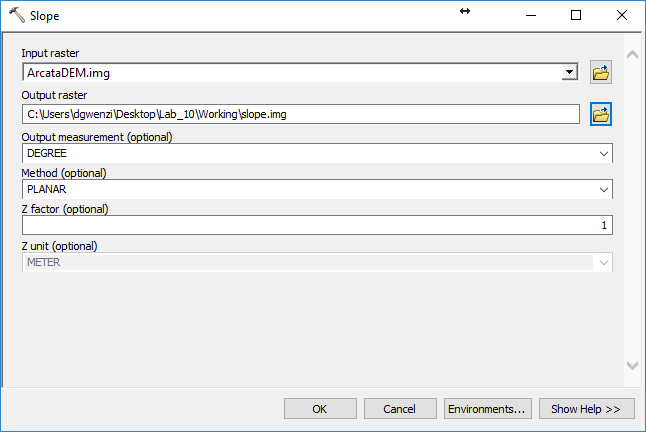
- Click "OK"
- ArcMap always adds a green to red color ramp to slope rasters, displaying flat areas as green and the steep areas as red.
- Next, use Raster Calculator to create a Boolean raster where cells with slopes between 1 and 5 degrees are assigned a value of 1. This will show us the ideal areas for your homestead property.
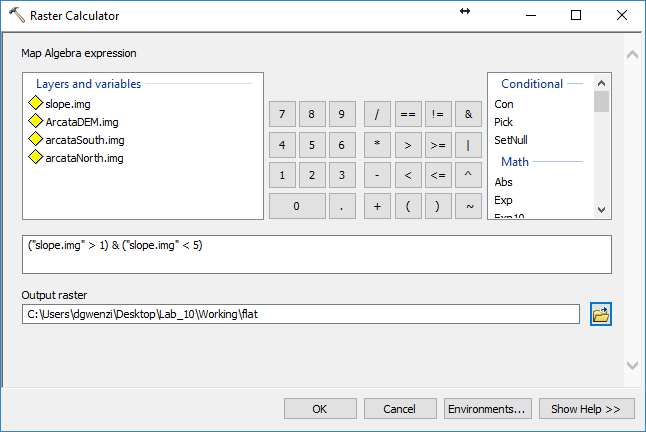
In Field Calculator, you can use the word "AND" for the Boolean AND operation. In Raster Calculator, the same operation is designated with an ampersand character ("&"). The "OR" operation is designated with a vertical "pipe" ("¦").
- When displayed in the data frame, areas where there slope is too steep will appear whatever color is assigned to the value 0, while areas where the slope is ideal for a homestead property will appear whatever color is assigned to the value 1.
Walk Through: Creating an Aspect Raster
The next step is to create an "aspect" raster. The "aspect" is the direction a slope is facing. People, and some plants, like to live on the south-facing slopes in northern latitudes because there is more exposure to the sun.
- In ArcToolbox, select "Spatial Analysis Tools" → "Surface" → Aspect
- Set the "Input Raster" as your Arcata DEM
- Save the "Output" raster in your working folder and name it "Aspect.img"
- Take a look at the values in the legend on the map. ArcMap finds aspect for each pixel in one of eight cardinal directions. These are colorized in 45 degree slices where 0 degrees is a north-facing slope (actually from 337.5 degrees to 22.5), 22.5 to 67.5 is a northeast facing slope, and so on going clockwise. Flat areas are set to -1 to show they do not have an aspect (i.e. they don't point in any direction).
If you want to visualize aspect with arrows that point "downhill" you'll need to use another GIS package, such as BlueSpray.
- Use Raster Calculator to create a raster with 1s where the aspect is generally south-facing, or between 135 and 225 degrees. Remember that you'll need to remove the flat spots.
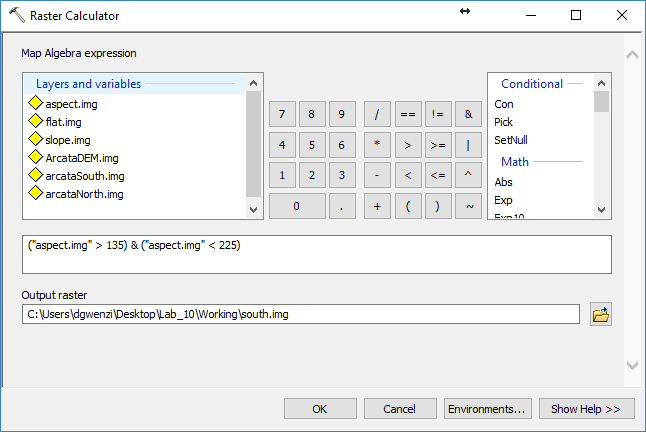
Note: You can perform the same function with the "Reclass" tool in ArcGIS but your results may vary because the tool does not allow you to specify what happens with integer values.
Pan around the map a bit and you'll notice some strange patterns just to the north of Arcata Bay. These are caused by not having enough precision in our DEM. If we were going to work in the flat lands, we would need a higher precision DEM.
Walk Through: Creating a Simple Model
You can now create a simple, initial model for your homestead/property by either using the "AND" function or by multiplying them together.
If your rasters are both just 0s and 1s, you can multiply them together and get exactly the same result as you would using the "AND" operator. Desirable cells will have a value of 1, and undesirable cells will have a value of 0.
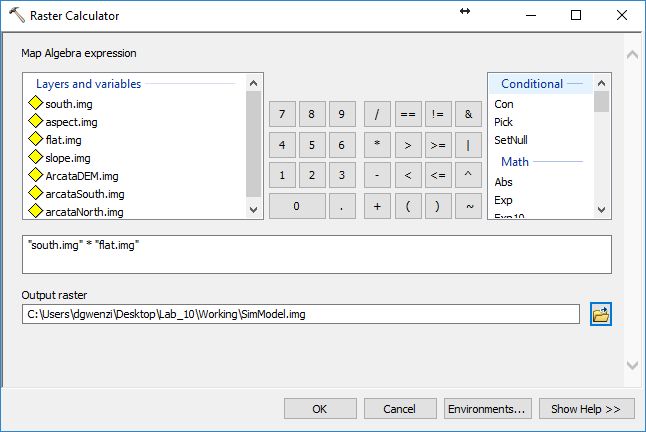
- Take a look at the result and compare it with your original slope and aspect rasters.
Walk Through: Creating a Hillshade
- Create a hillshade from your DEM and compare it to your model to see if it makes sense.
- Create a hillshade using "Spatial Analysis Tools -> Surface -> Hillshade"
- See the supplementary learning module "Hillshades" for more detailed instructions.
Hillshades are rarely used in analysis, but are commonly used in producing maps, as they give us a better "feel" for what is happening with the terrain than a DEM, slope, or aspect raster.
Walk Through: Raster to Polygon
You should now have a raster of your simple model results, where suitable land is represented by a 1, and unsuitable land is represented by a 0. The analysis we want to do next requires we convert our potential suitable site areas into polygons.
Note that the "Raster to Polygon" tool and, for some unknown reason, will fail if your file paths have any spaces in them. You'll want to replace the spaces with underscores ("_") before running the tool. In general, it is a bad idea to include any punctuation other than underscores in any folder or file names when working with GIS software.
- We no longer care about cells with a value of 0, so let's remove them.
- Using the Reclassify tool, reclassify all 0 values to "NoData". Remember you need to change the "new values", not "old values"
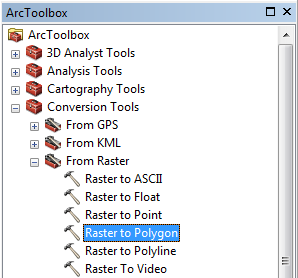
- In ArcToolbox, select "Conversion Tools" → "From Raster" →; Raster to Polygon
- Select your simple model as the "Input Raster"
- The "Field" value should only have one entry "Value" so just select this entry.
If you follow a different set of steps for the processing, you may need to select a different entry than "Value". This value will be inserted as the value for each raster pixel in the output so select the "Field" that will allow you to process the raster in the way you desire.
- Set the "Output" to your working folder and name it "PotentialSites.shp"
- Make sure the "Simplify Polygons" checkbox is unchecked. This will make the polygons follow the edges of the raster which is a more accurate representation of the data in the raster (i.e. you're not losing any information). If you're using the polygons for visualization, you will probably want to check "Simplify Polygons" because it will look better.
- Click "OK" and you should see a polygon feature layer appear.
Now we will select the best possible site for your new homestead.
- Add an "Area" field to your shapefile's attribute table and compute the area for each polygon
- Right click on the heading of the "Area" field and "Sort Descending." This will place the largest area on the top of the list. This will be our homestead
- Export the selected polygon with the largest area and save it to your working folder as a shapefile. Call it "homestead.shp".
- Remove any unnecessary layers from your table of contents.
- Don't forget to clear your selection.
Walk Through: Creating a Viewshed
A viewshed shows the area of land that can be viewed from a specific location. We'll want to select one potential site and then convert it to a point for the viewshed tool.
- The next step is to create a point within your polygon.
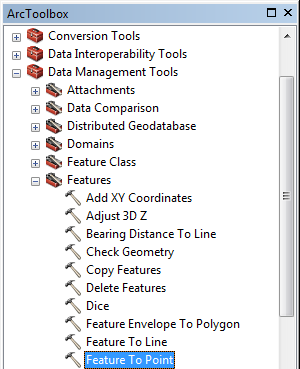
- In ArcToolbox, select "Data Management" → "Features" → Feature to Point
- Select your shapefile as the "Input Features"
- Make sure "Inside" is checked so you have a point within a shape
- Give the "Output Feature Class" a good name such as "LookoutTower.shp" and save it your working folder
- Creating the viewshed:
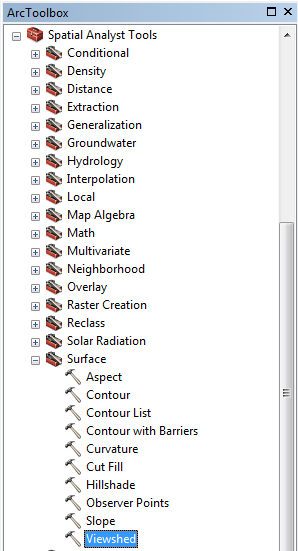
- In ArcToolbox, select "Spatial Analyst" → "Surface" → Viewshed
- Select ArcataDEM.img as the "Input Raster"
- Select your new (point) homestead layer for the "Input points...features"
- Give the "Output Raster" a good name like "Viewshed.img" and save it to your working folder
- Click "OK"
- The resulting raster will show you the pixels in the raster that can theoretically be seen from your site points. Take a look at the result.
Your point may be on the top of a hill, or flat area which limits what is "visible." This is because the viewshed tool in ArcMap assumes that you are looking from ground level (i.e. like you're buried up to your eyes at the site point).
- Add an attribute to your "LookoutTower.shp" shapefile named "OFFSETA." This field has to be exactly this name (this is unusual in ArcGIS but check the help for more information). Set the "Type" to "Double."
- Set this value to 5 to indicate you want to see what the view is like from 5 meters above ground level (the height of the view from our second story house).
- Open the Viewshed tool again. This time, ArcMap should find the "OFFSETA" value and your viewshed should be larger.