In the previous two labs, we found out where to acquire data, we performed a standardized quality control and quality assurance procedure, and we narrowed down a number of potential locations for our music festival based on a specific set of criteria.
In this scenario, we have presented our findings to the site selection committee and they have made a final decision on our site location. In order to determine the initial feasibility of this site, we are now tasked with estimating event capacity at this location. Capacity and the number of tickets sold will be determined by the most limiting of three factors:
The concepts and procedures in this lab have already been covered earlier in the semester and should now be familiar to you. As a result, this lab will have limited "Walk Through" sections. For all the other tasks, you will perform a series of "Skill Drills" in order to learn to apply your knowledge on your own.
It may be necessary to read the instructions carefully. Please read the instructions several times, and try to solve the problem on your own, before calling on your lab instructor for help.
By now you should be familiar with file management protocols for GIS. In a workplace setting, having consistent file management protocols is necessary to prevent errors and lost data.
Set up your basic folder structure for this project within a parent folder and 3 subfolders: originals, working, final. Once this is done, download the lab data using this link:Music Festival III Data and save it your originals folder. This data is in file geodatabase format. Do you recall this format from class lectures? You will now learn to extract and use data provided in this format.
In your originals folder, right-click on Lab_07_data.zip and choose 7-Zip and then Extract Here.
Launch ArcMap and in ArcCatalog, connect to your workspace.
In ArcCatalog, navigate to your originals folder and expand "lab_07_data.gdb" to see the data layers that are in the file geodatabase.
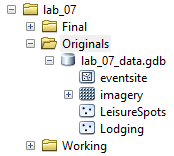
Drag all the layers into the map and change your order of display such that the point data is on top and the raster layer is at the very bottom.
It may look like the data is corrupted because you cannot see the image. It's okay. This is because the points of interest and leisure spots are all over Humboldt County while the image covers only the extent of the last lab's final parcels.
Now zoom to the "eventsite" layer and you will see that the selected parcels are from the previous lab. You could use your data from the last lab but we want to make sure everyone is able to move through this lab together so we'll be starting with the same data.
Note: For this lab, all work will be done using the NAD 83 UTM Zone 10 N spatial reference system
Now you will export each layer with its original name, but to your Working folder and save all the vector data as .shp and raster data as .img.
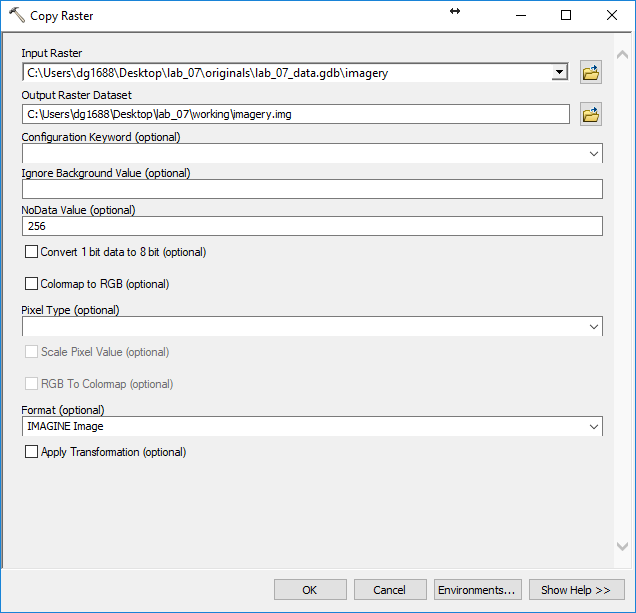
Click "OK" and if a pixel depth warning message appears, click "Yes".
Note: You can also export the imagery file from the Table of Contents but Arcmap sometimes crashes when using that option. If you want to export shapefiles using the ArcCatalog option, you would simply right click on each layer and choose "Export" then "To Shapefile (single)"
Make sure the new data is in the above mentioned Spatial Reference System.
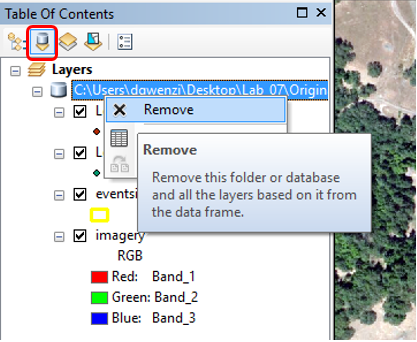
You can now remove all the Original files from the map at once by switching the Table of Contents to List By Source then right-click on "C:\Users\....gdb" and select "Remove"
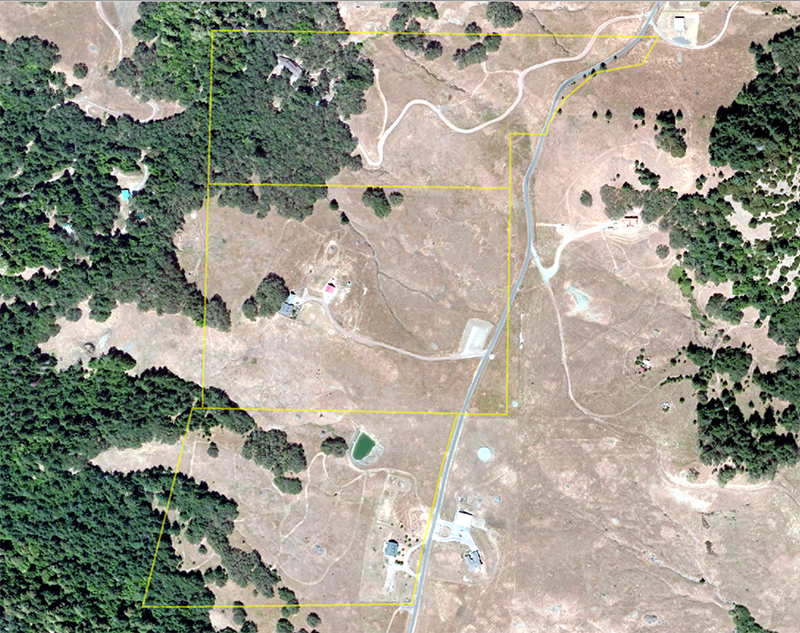
Our first step will be to determine capacity based on parking. The planning committee has decided that parking spaces will be set up in the northern parcel, just below the driveway, and to the western edge of the tree line. See the image below to understand which area needs to be digitized.
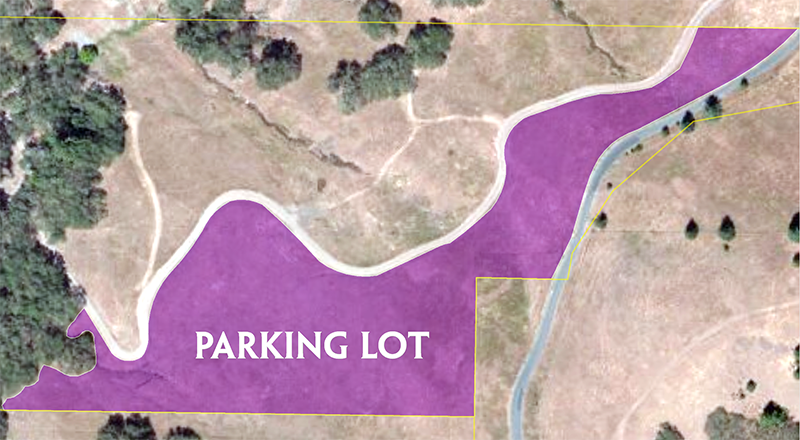
Create a new shapefile in your working folder called "parking.shp" and digitize the area that will be designated as a parking lot as shown in the image above.
Warning: Be sure to save your edits, then STOP editing when you are done.
In this step we will add a series of fields to the attribute table of our parking shapefile.
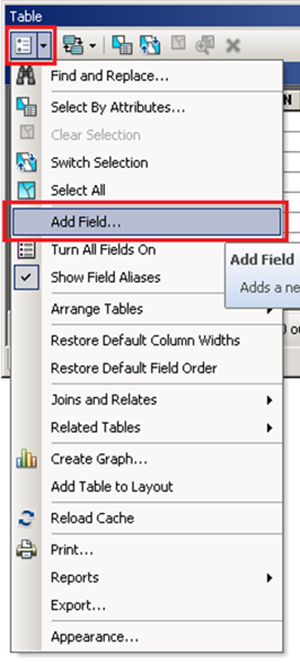
The first field will hold the label seen in the image of the parking lot above. The field type should be "text" and the field name should be "Name".
The second field will hold the area in square meters. Calling this field "Area" would be appropriate. The field type should be a "double".
Next add a field called "Count". We can't have less than a whole parking space, so we will need whole numbers. This field type should be a "long integer".
The last field will hold the estimated number of attendees based on parking spaces. We can't have less than a whole person, so we will need integers for this field as well. This field type should also be a "long integer". You should call this field "Capacity".
Now that our fields are ready, we will calculate the total area of our parking lot. We will be using this area field in subsequent calculations for determining capacity.
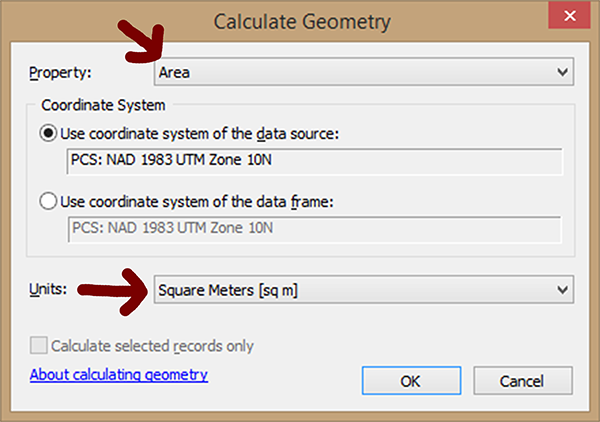
Use "Calculate Geometry" on the "Area" field. Be sure the area units are set to square meters.
| Name | Area | Count | Capacity |
|---|---|---|---|
| Parking | ######.## | #### | #,#### |
Now would be a good time to open Microsoft Excel and begin tracking your results. Create a table with the headers shown above. In the first row of your table, record the value you get for your total parking area.
Note: You will need this information along with your other results to submit in your report.
Now that we have the total area designated for parking, we can estimate how many parking spaces will be available to our attendees.
We will use the Field Calculator on the "Count" field to determine the number of parking spaces using the following criteria:
Hint: Since we need to convert the result to a whole number, the Int() function (available in the Field Calculator), will convert floating point numbers to integers. It will also"truncate" the result rather than rounding since we do not want any partial spaces.
To use the Int(formula goes here) function, place your formula inside the parenthesis.
Open the attribute table for the parking shapefile and right-click on the "Count" field and then select "Field Calculator". You will get a warning that you are outside an edit session. This is fine, click "Yes" to continue
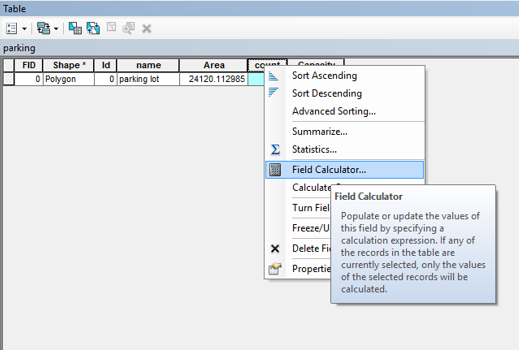
Our formula for parking count is (Area*0.8/30) - 20. Double-click on "Int( )" under functions and enter the formula for "Count =" inside the parenthesis as shown below. Note that the field has to be inside brackets. To make sure a field is entered properly it will be easier for you to just double-click on it than typing it in.
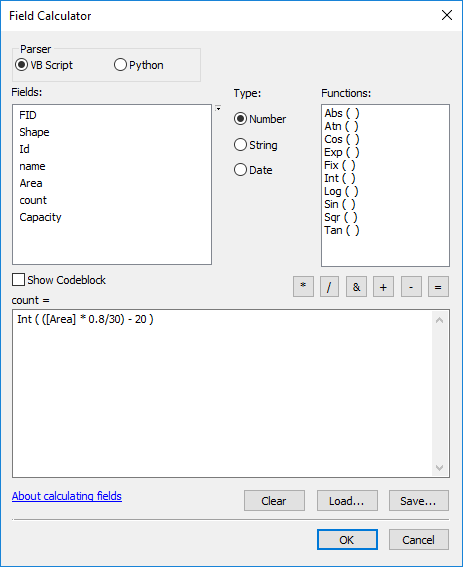
Click OK and review the result in the attribute table
The question we are trying to answer is, how many tickets can we sell if parking spaces were our limiting factor? The planning committee has decided that they will estimate an average of three people per car.
Use the Field Calculator on the "Capacity" field to determine the total number of tickets that can be sold based on the number of available parking spaces.
Another limiting factor is based on how many people, vendors, musicians, and staff can congregate in one place during the peak music festival activities.
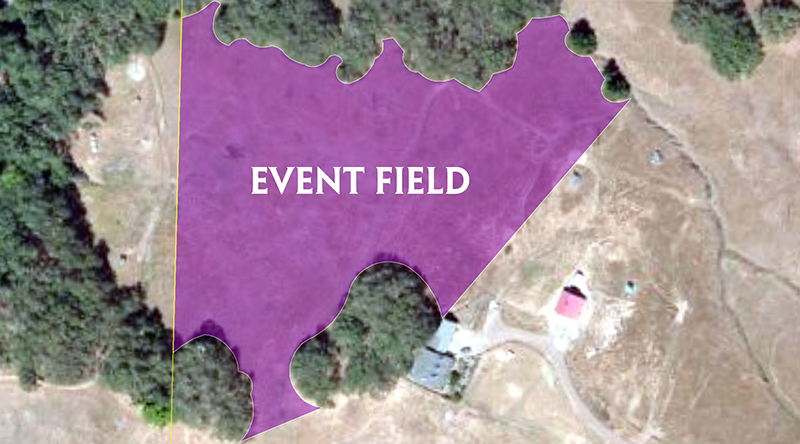
The Event Field will be located in the middle parcel just behind the residence on the west side of the lot. The open area extends in the neighbors property, so we will have to stay within the western boundary of the parcel. The Event Field will encompass the open area between the trees. The southern boundary will be a straight line between the opening of the trees. The eastern boundary will also be a straight line between the large opening in the trees. See the image above to understand which area needs to be digitized.
Once you have digitized the Event Field follow the same steps you performed for the Parking Lot to estimate capacity, with the following exceptions:
The criteria above represents the total number of people the Event Field can safely hold at once. This number should go in your "Count" field.
The planning committee does not expect every single attendee to be present in the Event Field at once, even during peak festival activities. They feel confident to overestimate the capacity a little.
To obtain a shapefile for the campsites, we will not need to digitize this region. Instead will will use our existing layers and the overlay operations "dissolve" and "erase" to derive this area.
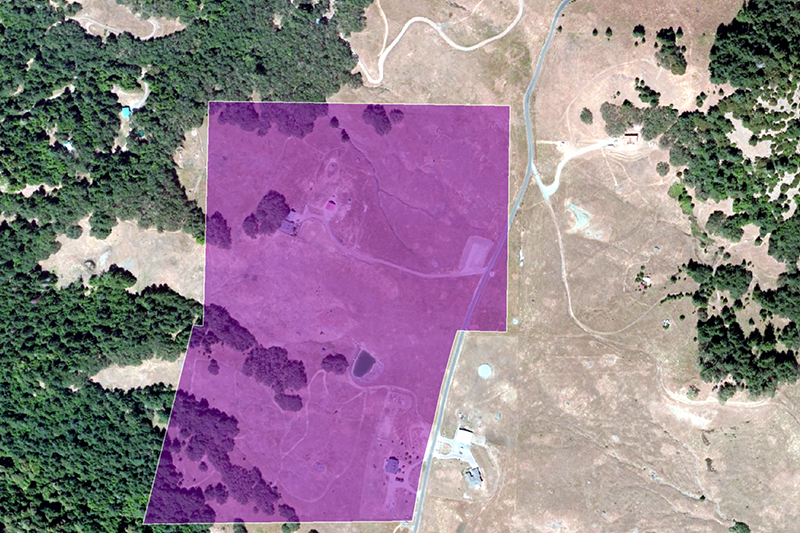
Our campsite will be located in both the middle and lower parcel in the eventsite original shapefile. The first step in generating our campsites will be to select these two parcels, create a shapefile out of the selection, then "dissolve" them in to a new shapefile with a single polygon. The image above shows the two parcels dissolved into one.
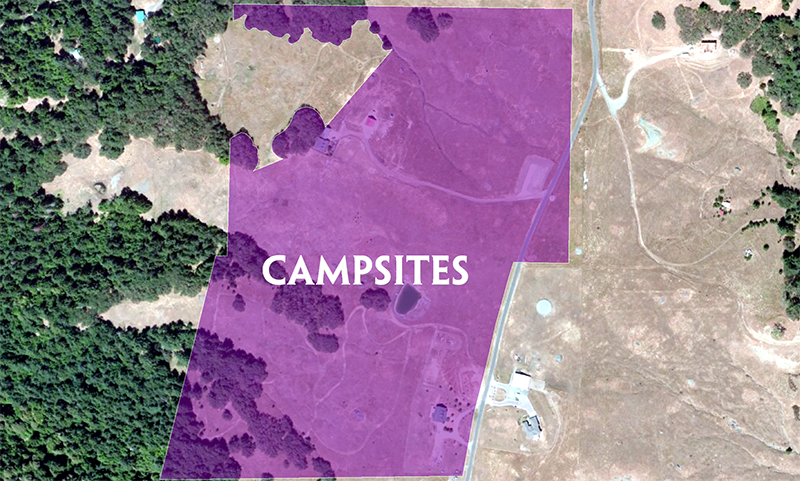
We will now use our "eventfield.shp" to "erase" the area that contains the Event Field from our "dissolved" layer. The result should be a shapefile that you name "campsites.shp". See the image below to help understand what the output might look like.
Once you have the layer for the campsites, follow the same steps you performed for the Parking Lot and for the Events Field to estimate capacity, with the following exceptions:
Once the total number of campsites has been calculated in the "Count" field you can estimate the "capacity". In order to do this, use the following criteria:
For marketing purposes, we would like to inform our potential attendees about the availability of leisure spots and lodging places within the music festival site’s surroundings.
We need to find the number of leisure spots within a 30 km radius of the Event Field site. We will use the tool called Spatial Join for this purpose.
Your Spatial Join window should now look like the one below:
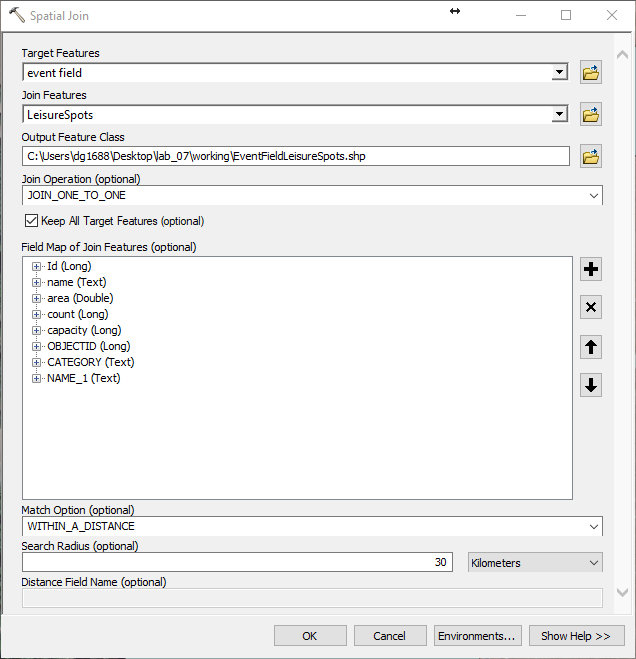
Now open the attribute table of the EventFieldLeisureSpots shapefile and you should see a field called Join_Count. This is the number of leisure spots within a 30 km radius of the Event Field.
If your Target Features layer had more than one polygon, the Spatial Join output would have had as many rows as the number of polygons, with each row showing the number of the Join Features within the 30 km radius of each specific polygon.