Digitizing Your Neighborhood
Introduction
In this lab we will be continuing to exercise our digitizing skills by digitizing features from a georeferenced source. You should begin this lab with a mental map of the parts of your neighborhood you would like to digitize. This should include three different data types: points, lines, and polygons.
Learning Outcomes
- Digitize spatial features as points, polylines, and polygons
- Add Minimal Formal Metadata
- Estimate Uncertainty
- Calculate Distance
Skill Drill: Setting up your Workspace
First we need to set up our workspace and add the basemap data to our workspace.
- Set up workspace/folder structure. By now you should be familiar with this process. Be sure to include your three sub-folders: Originals, Working, and Final.
- Obtain the lab data based on:
- If you are on one of the lab computers:
- Copy the "Y:\Static-Data\NAIP Aerial Photos\Humboldt County\NAIP2012.7z" data to your "Originals" folder. This is a large file containing "NAIP" imagery. It may take several minutes to download.
- Otherwise, download the NAIP Imagery Here and save it into your "Originals" folder.
- If you are on one of the lab computers:
- Decompress the file using the 7-zip software. By now you should be familiar with this process as well.
- Open ArcMap
- Add the NAIP base imagery data, with the ".sid" extension, to ArcMap. If asked to create pyramids, click "Yes".
The NAIP image is a high resolution aerial image of Humboldt County. The image is stored in a special file format, "MrSid", that provides fast access to different resolutions (zooms) of the image. If you do not see the image, there are number of things to try:
- Use "Add Data" instead of dragging and dropping the data into ArcMap.
- Right click on the layer and go to "Properties". Select the "Symbology" tab and select "Stretched" and then "Minimum-Maximum" for the "Type". This should compute statistics for the raster and then display it correctly.
Walk Through: Determining the Spatial Reference System
We need to check the spatial reference system for the basemap image to make sure we correctly project the shapefiles we create later on in this lab.
- Check the spatial reference system for the NAIP image and find out which one is used.
- Right click on the layer name. This will be the name of the image file in the table of contents, NOT the word "Layers".
- Select "Properties"
- Select the "Source" tab
- Scroll to the "Spatial Reference" Section and take a note of what it is. You will refer to this information when creating your new shapefiles.
Skill Drill: Finding Your Neighborhood
You should be able to locate your neighborhood on the basemap image, but if you cannot, please follow steps 7-8. Otherwise, skip to step 9.
- If you can't find your neighborhood on the NAIP image, visit
http://geocoder.ca/textscan
- Enter your home address in the "Extract locations from this text" text field.
- Change the popup menu next to "Extract and Geocode locations from text" to "in CSV format"
- Click "Extract and Geocode locations from text"
- This should produce a file that contains the latitude and longitude of your address.
- In ArcMap, click on the Go to XY
- If you do not see the option, click on the little arrow on the far right of the tool bar that contains the magnifying glasses and select the Zoom to icon on the Go to XY toolbar (This will take you to your neighborhood).
| |
button in the tool bar to enter your lat/long values. |
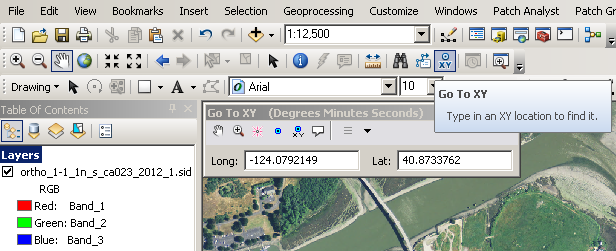
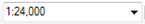
- You must keep a constant scale when digitizing your neighborhood, and you need to record the scale in your metadata. You can locate the scale of your image on the toolbar in the ArcMap interface (see below):
- Zoom into your neighborhood and pan around until you can see your house and at least 8 buildings, 2 streets and 20 trees or other point features. Once you have identified your neighborhood and an appropriate scale, create a Spatial Bookmark:
- Select the "Bookmarks" button at the top of the ArcMap interface
- Select "Create Bookmark" and name it "Neighborhood"
Skill Drill: Creating New Shapefiles
Next you will create shapefiles that will contain the shapes of your neighborhood (buildings/sstreets/trees/etc.).
Note: Make sure you create the files in your "Working" folder. This will make it easy to turn them in later. Be sure to match the projection used by the satellite (NAIP) image.
- Create new shapefiles for digitizing your neighborhood (See Lab 1 for a refresher on how to complete this task). Be sure to match the projection used by the satellite (NAIP) image.
- Polygon shapefile for buildings or houses
- Point shapefile for trees or light posts or fire hydrants
- Polyline shapefile for streets
- Additional features? Include more shapefiles if desired
- Before saving your "mxd" file make sure the file is set to "Store relative pathnames to data sources", otherwise, if you move your files to another computer or folder, ArcMap will not be able to find them. This option is available in "File -> Map Document Properties".
- Add the Editor toolbar window. If it is not visible:
- Select the "Customize" button at the top of the ArcMap interface
- Select "Tool bars"
- Click on "Editor"
- This will add an editor toolbar to your ArcMap interface
Skill Drill: Digitizing
- Digitize your neighborhood by editing your new shapefiles (create new features in the shapefile)
- Digitize at least 8 polygon features, at least 2 polyline features, and least 20 point features
- See Lab 1 Instructions if you need help
Note: The resolution of your images will change the accuracy (also known as uncertainty) of your digitizing (i.e. you cannot digitize better than the size of a pixel in your rasters) but the accuracy will also be influenced by how many points you add and how careful you are. As you digitize, estimate about how closely you are following the actual features shown in the image. You will add this information to your metadata.
- Save edits/stop editing when you are done
- Zoom in on your digitized areas as far as you can, notice that your digitized lines and polygons may not match up perfectly? Try to estimate the number of pixels you are off by, just a rough estimate, which can give us an idea of the level of uncertainty. (Example: my uncertainty is about 3 meters/3 pixels). Include this information in your metadata and final report.
Walk Through: Attributes
In addition to spatial data, we also want to be able to work with "Attributes" for our spatial features. Attributes allow us to add labels, addresses, names, and a wide variety of measurements to our data.
- First, make sure you have stopped editing.
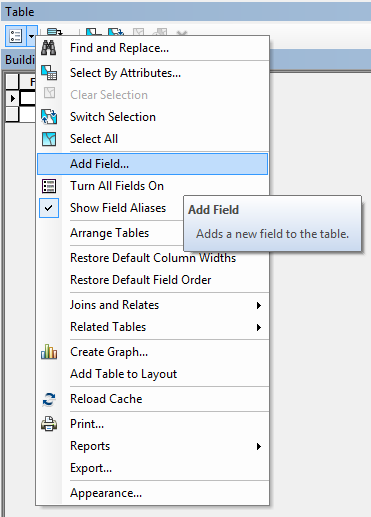
- Right click on one of your digitized layers and select "Open Attribute Table".
- Click on the little arrow in the upper left corner of the window that appears and select "Add Field..."
- In the dialog that appears, enter a good name in the "Name" field and select the "Type" as "Text".
- For your buildings and streets layers:
- Select "Add Field" again.
- For your buildings layer, enter the name as "Area", for your streets layer use "Length".
- Select the "Type" as "Double"
- You can only create fields outside of an edit session but you can only edit attributes in an edit session so start an edit session now.
- Enter good names for your features.
- For your buildings layer:
- Click on "Area" at the top of the attribute table and select "Calculate Geometry".
- Leave the other sections as they are and click "OK".
- ArcMap should compute the area of your buildings and these are relatively good measurements because we are in a UTM spatial reference.
- For your streets layer, repeat the process above except use the "Length" attribute and set it to the "Length" of the streets.
Labeling Features
One of the things you can do with attributes is label your features.
- Enter the properties dialog for your buildings layer
- Select the "Labels" tab.
- You'll need to check the "Label features in this layer" check box and select the "Label Field" as "Name" to have the labels appear.
- When you click "OK", you should see the names from your attributes table appear in your buildings.
Note: ArcGIS does not do the best job labeling features. It is OK for analysis but typically we have to remove the labels in ArcGIS and then add them in another package to make them of professional quality.
Walk Through: Creating Metadata
Metadata is information about the data, (i.e. when it was created, where, by whom, etc,). It is absolutely necessary for all data files if they are going to be useful to others.
To add metadata, we must first select the "format" for the metadata. We'll be using the International Standards Organization (ISO) 19139 standard which is replacing the existing FGDC standard for US spatial data. Once we select this format, ArcMap will show us which fields in the metadata are required as we really don't want to fill out all of them (there are lots).
Note: The computers in this room reset every night. You will have to complete the following step (17) EVERY TIME you want to view and edit metadata! You may want to write it down.
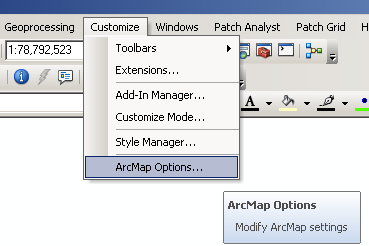
- Select metadata format
- Click the "Customize" button at the top of the ArcMap interface
- Select "ArcMap Options"
- Select the "Metadata" tab in the ArcMap Options window
- Click the pull down menu for "Metadata Style"
- Select "ISO19139 Metadata Implementation Specification"
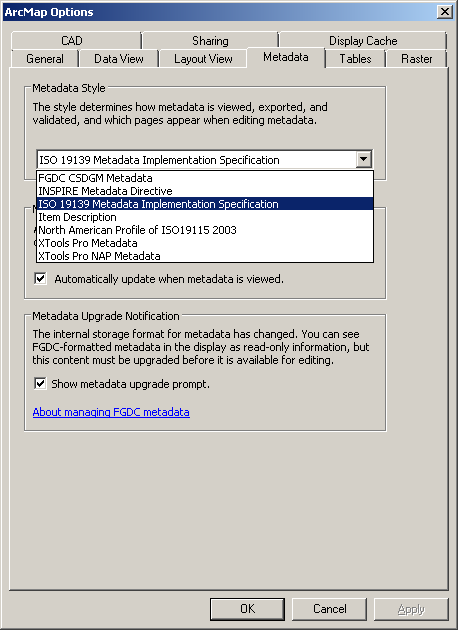
- Click "OK"
- Create the metadata
- In the catalog window, right click on your first shapefile
- Select "Item Description"
- In the item description window, select "Edit"
- Each section with a red "x" in the "Overview" panel needs to be filled out before saving the metadata.
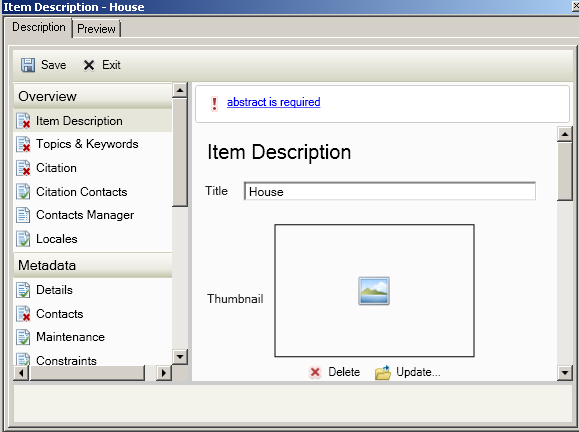
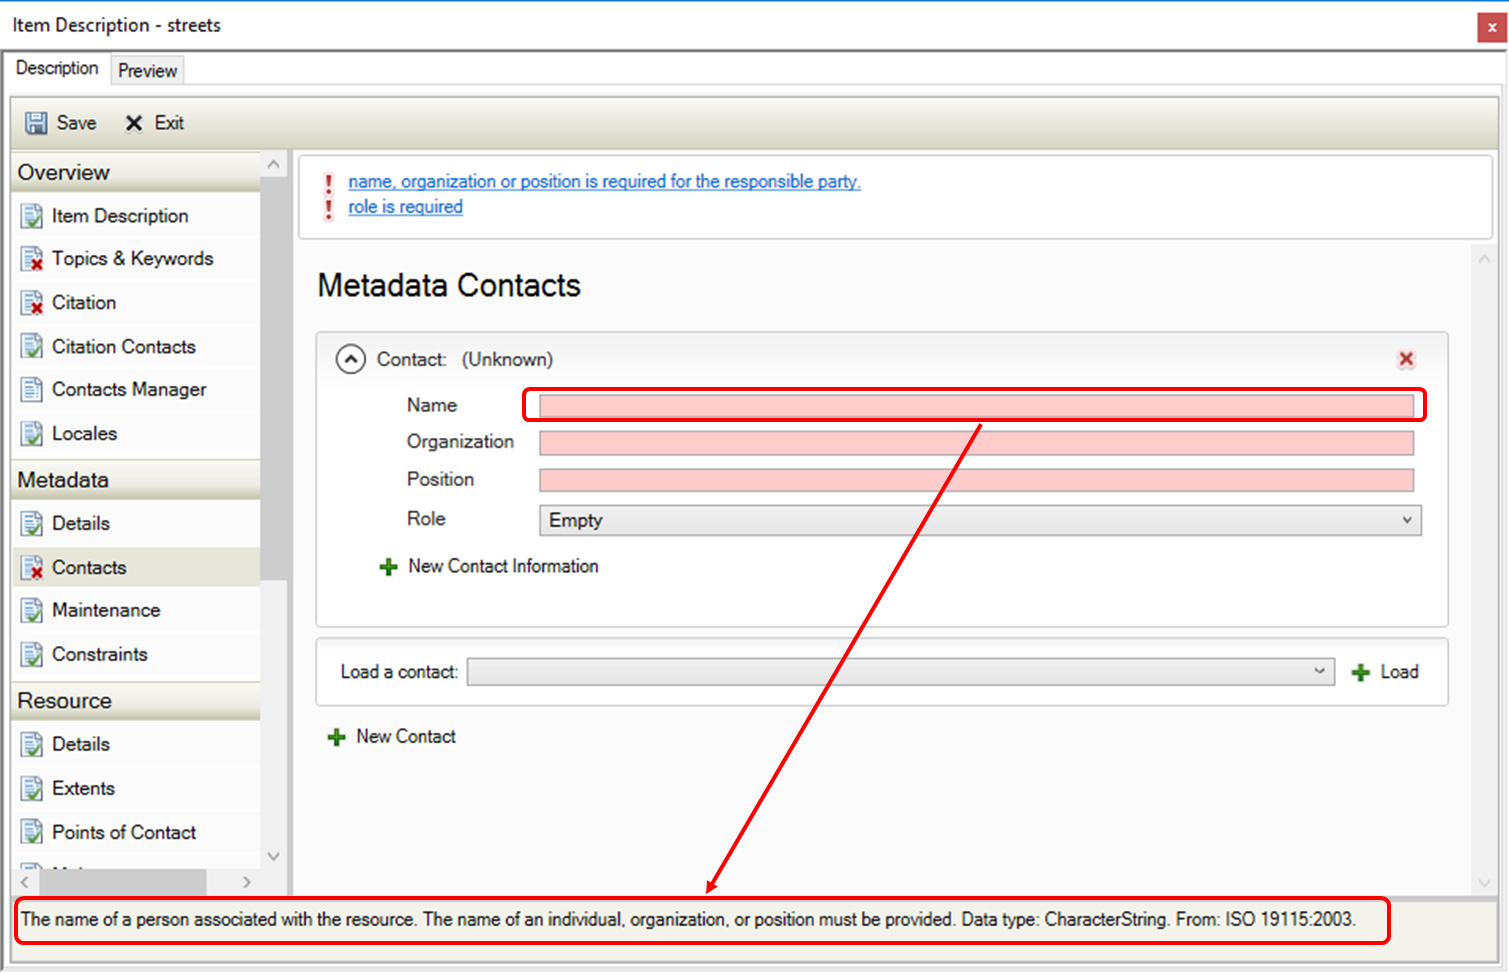
- Each section will show the items that need required metadata at the top of the edit window with a red exclamation mark. Sometimes, you can click on the link next to the exclamation mark and it will take you to the section that needs data. Other times you will need to look for it in the sections below. The areas that need metadata will be colored "pink". Clicking in the text entry boxes will show a hint in the space at the bottom of the window. This can help determine what should be in each entry.See the figure below as an example
- Use the Metadata Quick Reference to determine which fields to enter data into and what to put in them.
- Click on "Item Description" and complete the Title, Summary, Description and Credits entries. Make sure you document your scale and estimated uncertainty under the "Description (Abstract)" entry.
- Click on Save and then continue filling in all the other required items until you reach "Fields". This is where you will enter information about the attributes in your shapefile.
- Click on "Fields" in the "Overview" panel.
- Under Entity and Attribute Information, click the downward arrow next to "Details:...." to expand this section
- Click on the downward arrow next to Entity Type to expand that section
- Under definition, specify the name of the features, for example, if you were digitizing buidlings on HSU campus you would write something like "Buldings on HSU Campus"
- You are the source of this definition, so for Definition Source, type Author
- Click on the upward arrow next to Entity Type to minimize this section
- Expand Attribute: Id
- This attribute is auto-genrated by ArcMap and serves as an index number for each feature. For Definition, type Numeric index
- Like before, for Definition Source Type "Author"
- Click on New Range Domain and at the top of the edit panel, you'll see that a "minimum" and "maximum" range value is required. Under "Range Domain", you will also see two boxes that are colored pink indicating they need to be filled in.
- Enter "0" for the minimum and "9999999" for the maximum.
- Minimize the range Domain Section and then minimize the Attribute: Id section
- Repeat this for all the attributes that come after Attribute Id. These are the additional attributes you created in the files.
- You will notice that every attribute needs a Domain.
- For any text attribute e.g name, use New Unrepresntable Domain and in the text space, type Unrepresantable Domain
- For a numeric attribute e.g Area, use New Range Domain and fill in the Minimum and Maximum as you did above
- If you have entered all the required fields correctly, there should be nomore required items at the top of the edit panel. If you still see a required item, check through all your fields and make sure everything is completed
- Continue filling out the metadata until all the red "x"s in "Overview" panel are gone.
- Note that this adds an "XML" file to each of your shapefiles. You can either examine this data in ArcMap or in a web browser
Note: The red "x"s to the right of every attribute in the edit window do not mean you need to add metadata, they are for deleting items from the metadata, if you ever need to.
Skill Drill: Finish Creating Metadata
- Now continue to add metadata to your other files on your own.
If you are having trouble with this section, see the video below:
Skill Drill: Zipping Files
At this point you should have a set of shapefiles in your "Working" folder. We now need to zip them and upload them to Canvas.
- First, stop any editing and make sure you close ArcMap so your files are not locked.
- In Windows explorer, navigate to your "Working" folder and make sure that the NAIP image file is not in this folder. If it is, move it to the "Originals" folder.
- Right click on the "Working" folder and select "7-zip -> Add to "Working.zip"". This will create a new "zipped" file with all your shapefiles in it.
- Drag and drop your zip file into Canvas in the "Take Home" section.
- Back-up your data as you usually do