There is a huge amount of spatial data available on the Internet today. It is easy to find some data but often very challenging to find the data you want, in a form you can use, and of the quality you need.
Data are available in many forms and from numerous locations. Sometimes data acquired from the internet are already in a format which can be displayed in ArcMap, i.e. a layer is georeferenced (tied to a real world coordinate system) and is of an appropriate data type that can be “read” by the GIS software. However, this is rarely the case. Often data are not “ArcMap Ready” and will need to be preprocessed and incorporated into the GIS using various tools and operations within the software. When you download data from the internet, it is extremely important to acquire its metadata too. Metadata are data about your data (such as when it was created, who created, the source, what field names mean, etc.). Metadata may come in the form of a text file, an .xml file, or it may just appear on the web page.
Note: we'll be working in Nothern California and the surrounding area so we'll be using UTM Zone 10 North for all data. Make sure to project the data into this spatial reference system at the appropriate times.
National atlas is one of the easiest web sites to obtain data from. It also contains a huge assortment of data about the United States.
1. Just go to "www.nationalatlas.gov" or search the web for "National Atlas".
2. Click on "Mapping Professionals"
3. Click on "National Atlas Data and Documentation Download". You can now browse the content below by clicking on the arrows or colored boxes. You'll see there are a large number of data sets, mostly in shapefile format.
4. Click on "Boundaries" and then scroll down to "State Boundaries, Two Million-Scale".
5. Right click on the "statesp020.tar.gz" file name and select "Save target as..." or the equivalent for your browser.
6. Save the file into your "1_Originals" folder. The file is a ".gz" file which is a compressed format that we'll need to un-compress.
7. Go to the folder and right click on the file and select the "Extract to" option that is like the one below.
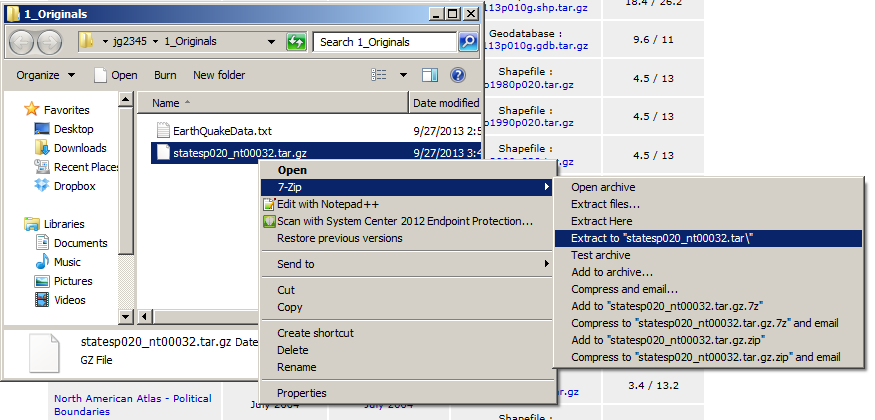
8. Open the folder for the file and notice that you now have a folder that has a name that ends in ".tar". Go into this file and you'll see there is a file that ends in ".tar". This is another compressed file and you'll need to right click and select "Extract to" again to decompress it.
9. Now you should have a folder named "statesp020" that you can copy to the root of "1_Originals" and then delete the other folders.
Note: If it seems silly to have folders compressed inside of folders, it is. But it's easy to address so I'd just go with it for now.
10. Now is the time to check and see if the file has a spatial reference and if it is correct. If not, you'll want to fix that now.
11. Load the file into ArcGIS and make sure all is well.
12. Finally, you'll want to project the data into UTM Zone 10 North.
When you have a chance, return to National Atlas and download some other shapefiles that you may be interested in. Remember this as a great source of data for the US.
X,Y data is typically provided as text (e.g., tab-delimited or comma-delimited) files which include specific x,y coordinate locations for each record. Let’s add some earthquake data from the web.
1. Launch Firefox and use Google to search for "Northern California Earthquake Data Center" (Click on the top link when Google returns a list of sites)
3. Scroll down and click on the link that says “Data Access”.
4. Under “Earthquake catalogs”, click on the link that says “Northern California”.You should now be on the Northern California Earthquake Catalog Search page.
5. To look at earthquake activity in our area over the past couple of years, enter "2000/01/01" as the "Start Time" and today's date as the "End Time". Note that the date is specified as (YYYY/MM/DD) format. Leave the "Min Magnitude" as 3.0 to leave out lots of small earthquakes. Enter latitudes from 37 to 47 and longitudes from -120 to -130.
6. Scroll to the bottom and click on "Submit request".
7. When the search completes, you should see a page with tables of numbers, including "Lat" and "Lon".
8. We are now going to bring the data into ArcMap but first we have to use Excel to prepare the data. Click just to the left of the column heading "Date" and then drag your mouse down to the bottom right of the entire data table.
Warning: Be very careful to click with the tip of the arrow just to the left of the ‘D’ in “Date” – grabbing the left edge of the table may copy some hidden HTML characters, which will confuse ArcMap.
9. "Copy" this text to the clip board.
10. Open Excel and click in the upper-left cell in the spreadsheet that appears.
11. "Paste" the text into Excel. You should see the data appear in the spreadsheet. Your file should look like the image below.

Stop for a moment and take a look at this file. How many columns does it contain? It actually only has one column. Excel and ArcMap will not understand that there are multiple columns of data so we have to let Excel know that the species in the file separate the values into columns. Then, we'll save it to a file that ArcMap understands.
12. We’ll need to do a little clean-up on this file in Excel to prepare it for ArcMap. First, right-click on the row with the line (row 2) and "Delete" it.
13. Next, click on the letter A to highlight the entire field (column) ‘A’, then click the “Data” tab at the top of excel. Then click "Text to columns".
14. Select "Delimited" and click "Next".
15. Now check "Space" and notice that the data now has bars between each of the columns.
16. At this point you should be able to click "Finish" and see a nicely laid out Excel spreadsheet. Your file should resemble the image below:

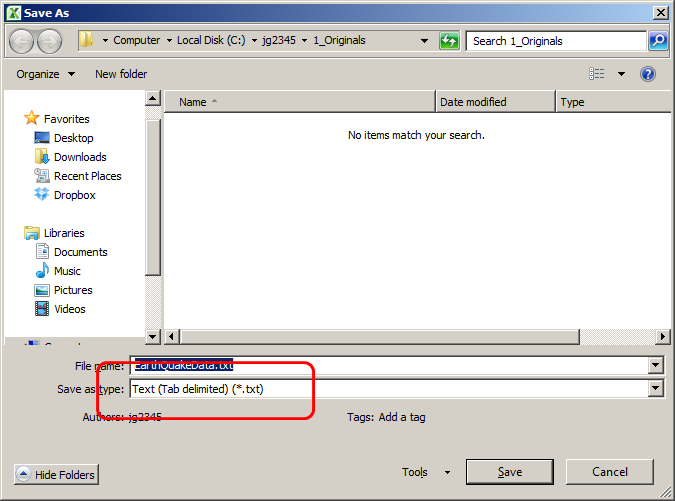
17. Save this to your "1_Originals" folder as "EarthQuakeData.txt". Make sure you change the “Save as Type” option to “Text (Tab delimited)(*.txt)” as per the image below:
18. Close the file in Excel. You may receive an error here that this file format does not support all the features of Excel. That's OK, we're just going to import the text into ArcMap.
Warning: You must do this to be able to open the file in ArcMap. Excel and ArcMap both like to "hold on" to files. Sometimes, even after you've closed the file, you'll need to close Excel or ArcMap to load the file in the other program.
19. Before going any further we should stop and record some metadata on what we have been doing. Go back to the web page and copy and paste the text above the table and paste it into a new Notepad document. Add you name and today's date so you know when you downloaded this data and save it as a "ReadMe.txt" file with your earthquake text file.
19. Our data is not yet in a spatial data file format so we have to load it into ArcMap through a special command. In ArcMap, go to the "File" menu, select "Add Data", and then "X,Y Data".
20. In the box that appears, select the browse button and browse to your text file. Take a look at the "fields" that ArcMap selected for "X" and "Y" and make sure they are correct.
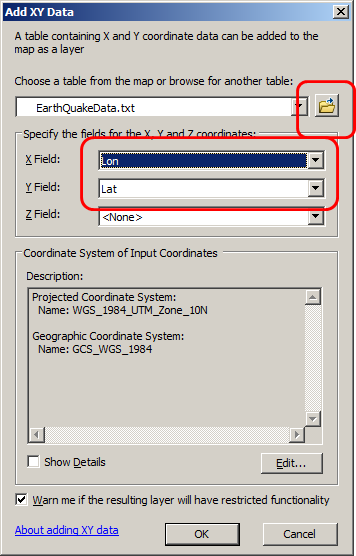
Warning: One of the most frustrating defects in ArcMap is that it only allows 10 character header names in text files (or shapefiles). If ArcMap sees more characters, you will just see blanks in your popup menus for the "X Field" and "Y Field". ArcMap will do the same thing with files that have "special characters" which may be invisible in Excel. The best thing to do when this problem occurs is to open the file in a very simple editor like Notepad and make sure everything looks OK.
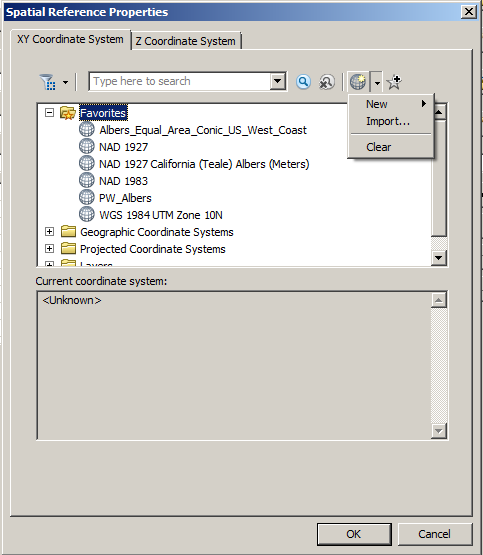
21. Now, click on "Edit..." and select the correct spatial reference/coordinate system for the data. The was in North America Datum 1983 (NAD 83) when this was written but you might want to check the web site.
22. Click "OK" and the data should appear correctly on your map.
23. The next step is to convert the text file to a shapefile so we can use all the tools in ArcMap with it. Right click on the layer and navigate to "Export -> Export Data". Give the file a good name and save it into your "1_Originals" folder as we have yet to modify the data.
24. Now we just need to make sure the spatial reference is the same as our states layer and if not, project it to the same spatial reference.
Note: a short-cut is to select the "Import..." option from the "Spatial Reference Properties" dialog and then select the states layer as the source. This will cover the new layer to the same projection as the states layer. Also remember to project it into your "2_Working" folder.
25. Now, symbolize your Earthquake data based on the value contained in the Mag (Magnitude) field using graduated symbols, as show in the graphic below. You can change the number of decimal places which display in your Table of Contents/Legend by left clicking below the “Label” header on the symbology tab and selecting “Format labels…” Change the number of decimal places to 1.

1. The "ETOPO" data set is a global elevation data set at 1km. While this is pretty course for local work, it's OK for large extents and background on some maps. Search for "ETOPO" on the web.
2. Click on the "NOAA" "Global Relief Model".
3. Click on "Extract Custom Grid" on the left.
4. This is a rather well written web interface to GIS data (there are lots of badly written ones). Pan and zoom the map to the Western United States.
5. Use the "i" tool to select an area that includes Oregon, Northern Californio, most of Nevada, and quite a bit of the ocean.
6. Make sure "GeoTIFF" is selected as the file type and click "click here to download".
7. Before going further, create a "ReadMe.txt" file with the date, your name, and where you downloaded the data from and save it with the file. This way, you'll always now where you got the data from and can get back to the right web site quickly.
8. At this point you'll also want to check the spatial reference and project the data into the one we are using for the lab.
9. Load the image into ArcMap. Do you see anything interesting about the distribution of earthquakes and the elevation raster you downloaded?
10. To see this more clearly, you can symbolize the raster by displaying it with a "Hillshade" effect.
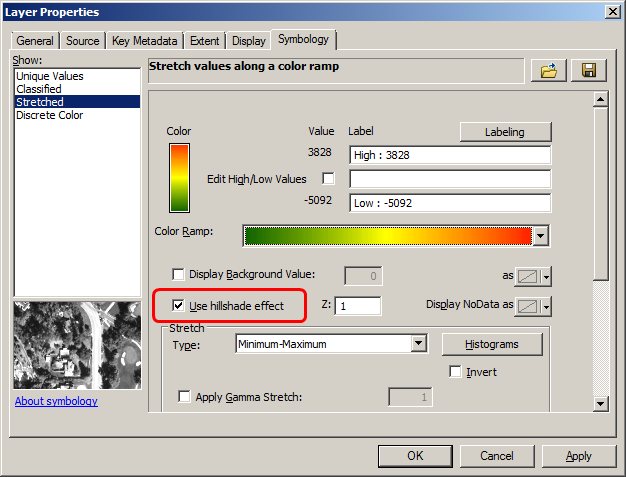
Note: The "hillshade" effect in ArcGIS 10.1 is a new feature and it has some problems. You can also run the "Hillshade" tool and then display the hillshade as 50% transparent on top of the original raster layer.
Extra Credit:
© Copyright 2018 HSU - All rights reserved.