Using Attributes to Symbolize a Map
Introduction
This brief tutorial will teach you to use attributes to symbolize a data layer on a map to make it more informative. Download the Humboldt County Zones shapefile here
- Drag the zones shapefile (humz38sp.shp) into the data frame
- Open and examine the attribute table. We will use the ABRREV field for symbology
- In the Table of Contents window, right click the humz38sp layer name and choose Properties
- Click the Symbology tab and on the left side, and under Show, Select Categories, and then Unique values. See below for clarification
- For Value Field, select ABRREV and choose a reasonable Color Ramp. Something with more and clearly distinct range of colors is recommended.
- Click Add All Values and you will see the colors populated under Value
- Click OK and you will see the categories and their corresponding colors under the humz38sp layer name in the Table of Contents


This is what you can use for the map legend. Now you need to clean it up
- Switch from Data View to Layout View
- From the ArcMap main menu, click Insert and choose Legend and on the Legend Wizard window that pops up, make sure humz38sp is included under Legend Items. If not, select it under Map Layers and use the Forward Arrow to push it into the Legend Items. If there is anything else in the Legend Items window, other than humz38sp, select it and use the backward arrow to remove it. See below for clarifications
- Set the number of columns to 2
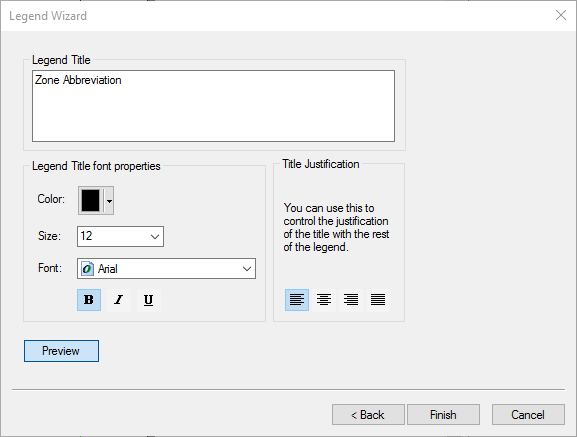
- Click Next and under Legend Title, delete the word Legend and type Zone Abbreviation. Set Font size to 12 and type to Arial and Bold
- Click Next and select a Border Type of your choice, and click Next and again Next in the window that follows, and then Finish
- To practice proper placement of your legend on the Map, set both the Data Frame and Page Layout to 6 inches X 6 inches. I assume you already know how to do this.

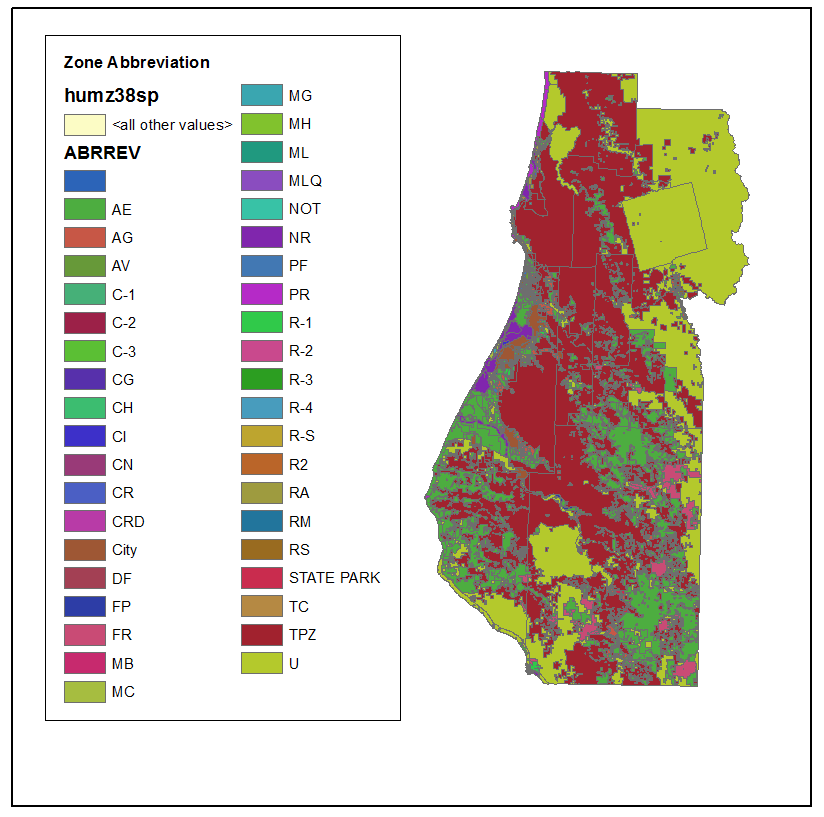
Now, you will need to clean up the Legend further
- Select the legend, right click and choose Properties
- In the Items tab, right click on humz38sp and choose Properties
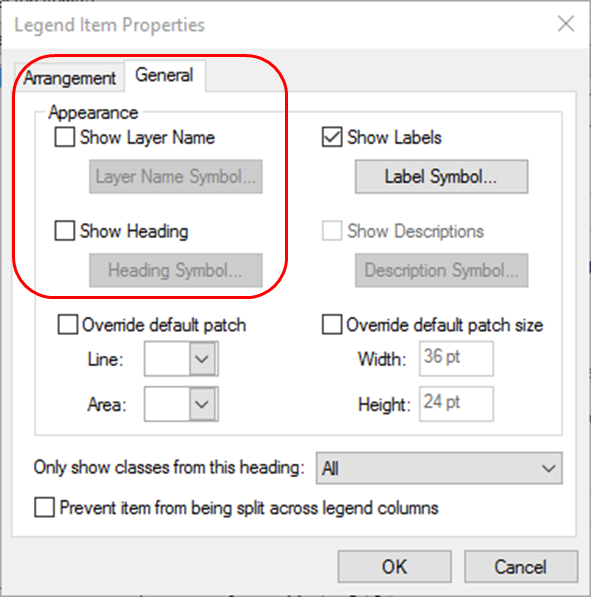
- In the Legend Item Properties window choose the General tab and uncheck the boxes next to Show Layer Name and Show Heading. See below for clarification:
- Click OK and again OK to close Legend Properties window
Now you will remove the ugly <all other values> entry and assign a label to the box that is blank
- In the Table of Contents window, right click the humz38sp layer name and choose Properties
- Uncheck the box next to <all other values>
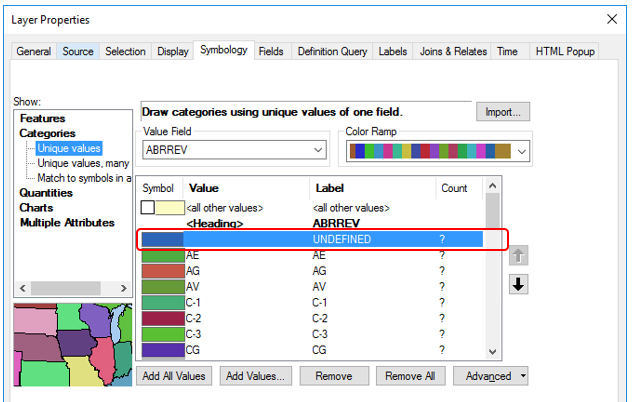
- Select (left click) on the category that has a blank label, and in that line, Click to place the cursor under ABRREV and Type UDEFINED. See below:
- Click OK to close the Legend Properties window and your Legend should look much neater now.
- If you want to change anything like Font type and size, Layout, frame, Size, Position, Number of Columns etc., you can always select the Legend, right click and open the Legend Properties window.
- Now you can add all other cartographic elements as necessary/required, e.g scale bar, North arrow, author, spatial reference system, etc.
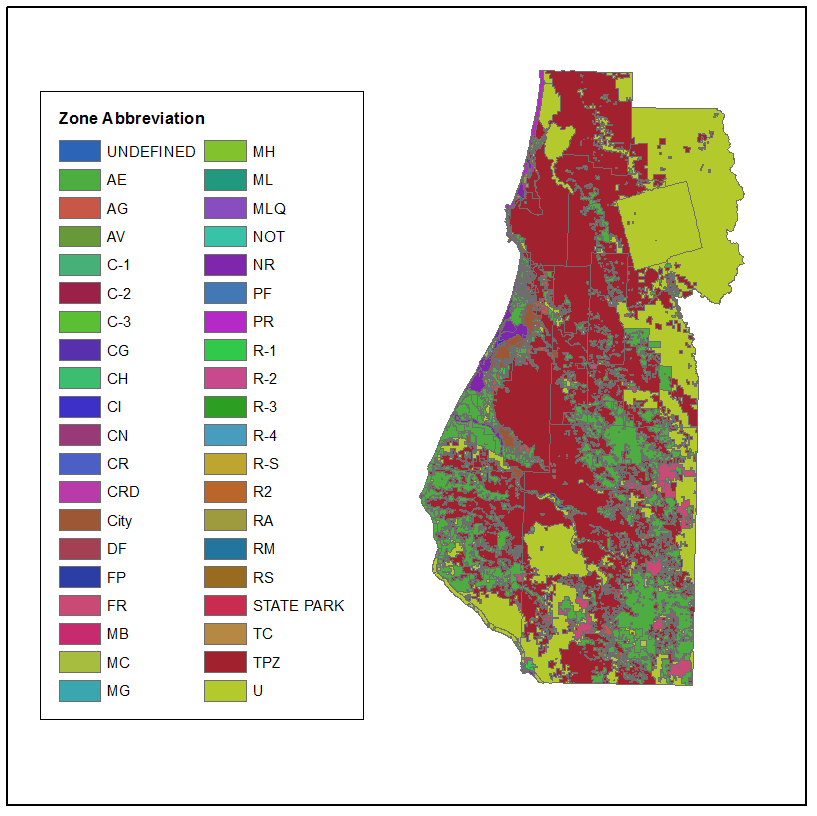
Sometimes legends are too big to show in the same map as the data layer or you may just want to show the data layer and legend differently in your report or presentation. Below, you will practice to do this.
- Open a blank word document
- Right-click on the legend and select copy then go to your word document, right-click where you want to place it and select paste.
- To export the map without the legend, in ArcMap, simply click on the legend and drag out of the Data Frame.
- You can now export the map via the File > Export Map protocol
- Feel free to experiment with different settings
Now that you have completed this tutorial, you can use the skills you have acquired here to symbolize any data layer that has an attribute table. The key thing is to identify which field in the attribute table can be used for the symbology process. Some attributes don’t make sense. Imagine trying to use an attribute that has over a thousand categories?

