Geospatial Analysis and Data Extraction
Introduction
We can gain a lot of information just by viewing remote sensed data and performing basic image enhancement, but there are more ways we can analyze remote sensed data. One of the main objectives of this course is to learn how to design, develop, and apply geospatial analysis techniques to answer questions and solve problems. After selecting and processing data the next step is to choose an appropriate analysis technique.
Digitizing
Digitizing is the process of converting images or raster data to digital vector data. The main method of digitizing is manual digitizing. Manual digitizing is human guided coordinate capture from a map or image source (tracing). Heads-up digitizing is the process of manually digitizing on a computer screen using a digital map or image as a backdrop. This process converts raster features to vector data. There are many reasons you may want to digitize raster data. Digitizing allows you to track the location, size (area) and movements of features over time.
Scale and Spatial Resolution
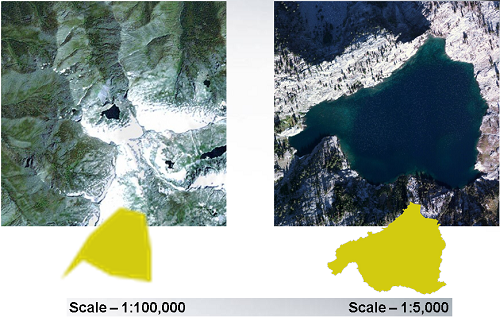
The spatial resolution and scale of a dataset can impact the accuracy of your digitizing. Knowing the scale you are digitizing at is critical to maintaining accuracy of the data you are creating. If you are digitizing relatively small features you would want to have a reference dataset with high spatial resolution. Below is an example of digitizing affected by map scale:

Measuring Distance and Area
Linear distances and areas can easily be measured on the fly for geospatial data. Most geospatial software packages include measuring tools to calculate linear distance and/or area measurements.
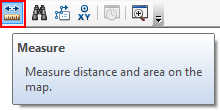
In ArcMap ,the Measure tool allows you to draw a single-segment or multi segment line to measure a linear path, or a shape to measure a specific area.

In ENVI, the "Mensuration Tool" will allow you to measure between multiple points.
This tool does not calculate area, but area can easily be calculated with a Region Of Interest.
Sampling Using Random Points
In ArcMap you can use the Create Random Points tool to generate a number of random points for a given area. This tool allows an analyst to select the number of sampling points and limit to points to any containing features or extents.
In ArcMap, The Extract Multi Values to Points tool can be employed to extract the cell values of a raster based on a set of points. The tool records the values in the attribute table of the output feature class. This tool allows you select the input point features (for example randomly generated points or predefined sample locations) and the raster (or multiple rasters) that you want to extract data from. The process will extract the values from the point location and add the values as seperate fields to the input points shapefile. This data can then be used for further analysis.
