Lab 9 Part 1 : Image Enhancements - Normalized Difference Vegetation Index (NDVI)
Introduction
Indices add, subtract, and/or divide the values of a pixel in one image or band with the spectral value of the corresponding pixel in another image or band. Indices are used extensively in mineral exploration and vegetation analyses to bring out small differences between various rock types and vegetation classes. In many cases, an appropriately chosen indices can highlight and enhance differences which cannot be easily observed by looking at the original image. In this lab we wil calculate two indices, the Normalized Difference Vegetation Index (NDVI) and the Normalized Burn Ratio (NBR).
Normalized Difference Vegetation Index (NDVI)
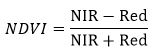
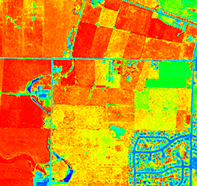
Normalized Difference Vegetation Index (NDVI) is designed to quickly identify vegetated areas and their condition or health. NDVI is calculated using the visible red and near-infrared bands.. Calculations of NDVI for a given pixel always result in a number that ranges from -1 to +1. Positive values indicate there is greater reflectance in the NIR as compared to visible (red). The larger the NDVI value the greater the density of healthy vegetation. Low to zero values indicate minimal vegetation. Values close to zero and negative generally correspond to impervious surfaces and water.
Learning Outcomes
- Learn about various spectral indices and calculate spectral indices in ENVI.
- Update metadata for files in ENVI
- Change Color Table Display for single band raster files to better visualize data in ENVI.
- Use the Cursor Value Tool to investigate pixel values and determine geographic coordinates.
- Use the ROI tool to sample data points from a layer
Part I: Obtain NAIP Image and Calculating NDVI
- Create a folder on your Desktop named "Lab_9_PartI"
- Open up your favorite web browsers and navigate to http://earthexplorer.usgs.gov and log into to your EarthExplorer account.
- For the location, select a location near where you live or work, or somewhere you have recently visited. Keep in mind that you will need to be able to provide a photo and description of the locations for part of this activity. We will skip the date section and move to the next section. Click on the “Data Sets” button to proceed to the next screen.
- Navigate to the “Aerial Imagery” heading and click the “+” beside the name to expand the category. You will now see all of the available aerial imagery options. Click the box beside "NAIP". This will only return NAIP imagery.
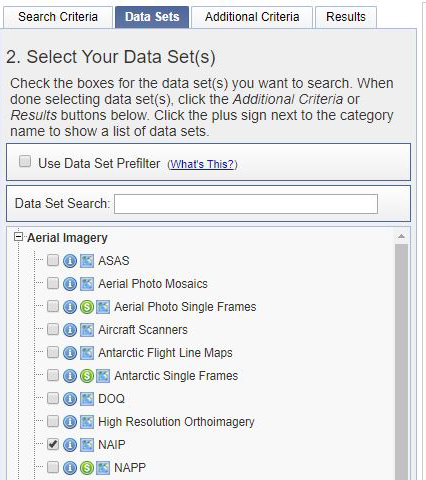
- Click “Results” and you should see thumbnails showing the data sets that match your search criteria.
- Select the most recent NAIP image and click the download icon and download the Full Resolution option. After downloading the image move the file to your Lab 9 "Part 1" folder. Unzip the file, you should now see a TIF file and the associated metadata.
Open NAIP Image and Calculate NDVI
- Start ENVI and Select File → Open and navigate to your Lab 9 Part 1 folder where you extracted your data. Select the file NAIP file you downloaded (.tif) and click open. You should now see the NAIP image you downloaded in your viewer.
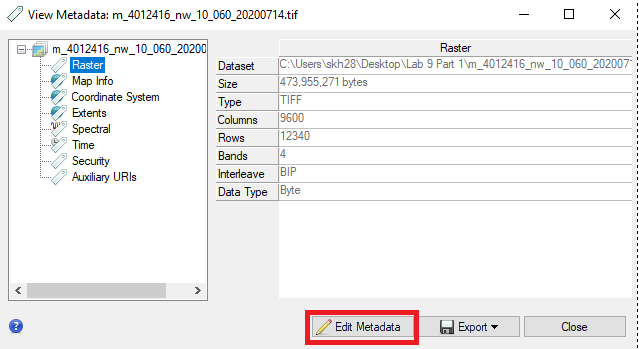
- By default, NAIP imagery is not displayed as a true color image because the metadata lacks the bands names and wavelengths. We will update the metadata to include this information. Right click on the image in the Layer Manage and select View Metadata. In the metadata window click Edit Metadata button.
- First we will update the band names. Locate the Band Names heading under the Display tab. For each band update the name based on the table below. Click the band name in the list then type the updated band names in the edit window and hit enter, do this for all four bands.
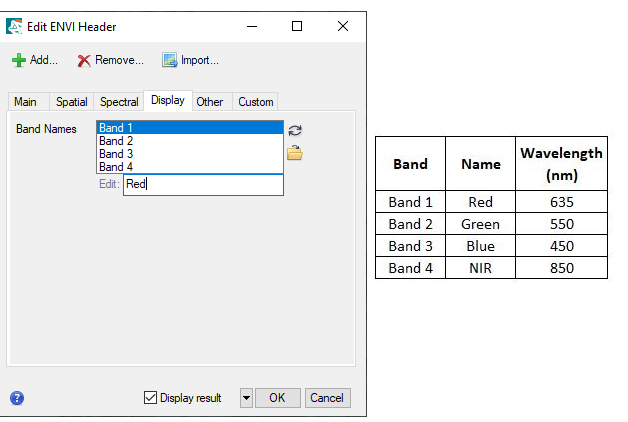
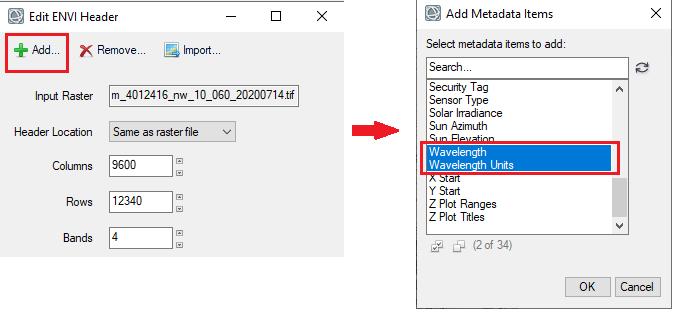
- Now we will add the wavelengths and wavelength units for the bands. Click the + Add button to add additional metadata fields. Select Wavelength and Wavelength Units (hold the shift key to select multiple items. In the Spectral tab, update the wavelengths for each band based on the above table and select nanometers as the units. Click OK when you are done. The NAIP image should now reload in the window in true color with the updated band names and wavelengths.
- From the Toolbox, select Spectral → Vegetation → NDVI or type "NDVI" in the Toolbox and open the NDVI tool. The NDVI Calculations window open.
- In the NDVI Calculations window select the NAIP file as the input file and under "Enter Output Filename" click Choose and locate your Lab 9 "Part 1" folder and type "NDVI.dat" in the file name and click Open. Now click OK to run the NDVI calculation.
- The NDVI layer will appear in the viewer. By default it will be displayed in grayscale (black and white). The possible NDVI values range from -1 to 1. Right click on the NDVI file and select "Quick Stats". This will show you the min, max and mean NDVI values in this image, write down this information. Close the window after looking at the statistics.
- Create a new view and drag the NDVI file into the new view and link the views (see video above step 7). Right click on the "NDVI.dat" layer in the Layer Manager and select "Change Color Table" and select one of the color tables. Applying a Color Table makes it easier to see the differences in NDVI (or any index) values. You may want to create a NIR false color composite using the NAIP imagery by changing the RGB band combination to NIR (R), Red (G), Green (B).
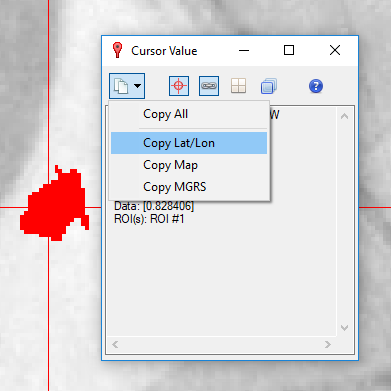
- Explore some of the NDVI values in the image by clicking the Cursor Value icon
 . This opens the Cursor Value window which shows the pixel value for the cursor location. The window will show the pixel values (data) for any files actively displayed in the view. The pixel value is listed as "Data" in the the Cursor Value window and for the NDVI file this represents the NDVI value. Write down the general range of NDVI values for different land cover types (water, agriculture, impervious surface etc).
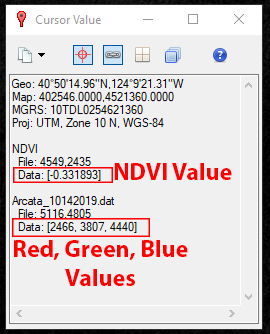
- You will need to select two sample locations on your NAIP image with different land cover types. Create a seperate ROI for each sample. Select a sample for each of the following two cover types:
- Vegetation (any type)
- Bare Ground or Impervious(Paved) or Water
Make sure this is an area that you can physically visit or have recently visited as you will need a photo for a subsequent assignment.
- Zoom in on the area you selected for your first sample site. For example, if your site land cover type is vegetation find an area with grass or a tree of interest. Right click on the NDVI file and select New Region of Interest. Use the ROI tool to create a region that encompasses the land cover you selected.Right click to complete and accept your ROI. Be sure not to make your ROI too large, keep the ROI small and focused around the area of interest. For example, if you decide to use a tree as your area of interest, make sure your ROI just encompasses the tree canopy. If your sample area is more uniform like a lawn/field or water body you make make the ROI slightly larger.
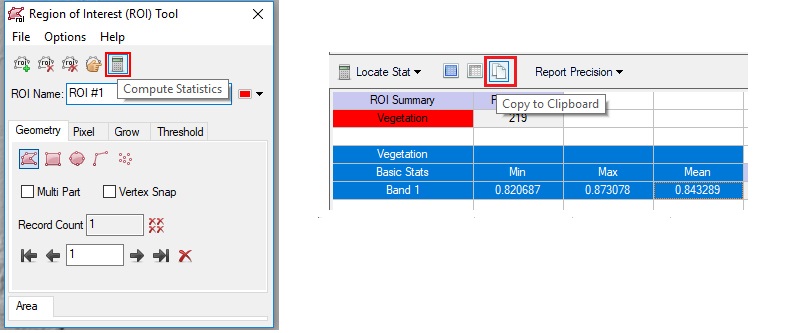
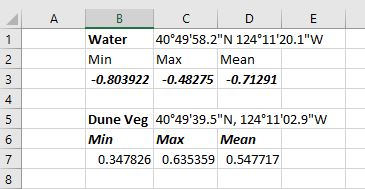
- In the ROI Tool Window select Options → Compute Statistics from ROIs. This will calculate the minimum, maximum and mean NDVI value for the ROIs you created. Copy the Min, Max and Mean NDVI values of the ROI and paste into a document or spreadsheet. You will need to submit this information.
- Repeat the above step by creating a New ROI for your second sample area (water/impervious/bare ground). Complete and accept your ROI for the second site and calculate and record the statsitics.
- The last thing we want to do is to record the latitude and longitude of each of the ROIs. Zoom in on the first ROI and click the Cursor Value icon . Center the cursor on the ROI. Click the icon in the upper lefthand corner of the Cursor Value window and select Copy Lat/Long. Paste this information into to your document/spreadsheet with the NDVI data for the site.
- Repeat the above step for the second ROI. You should have NDVI statistics and latitude and longitude data for two sample areas. See example below:
- In Canvas answer the below questions under "Lab 9 Part 1: NDVI":
- Submit your NDVI data for your two ROIs. Instructions and link to the data submission form are in the Canvas Lab 9 Part 1 assignment.
- What is the possible range of NDVI Values (not just for your site) and what was the range of values in your entire image? What do these NDVI values generally represent in terms of land cover type (for example what do negative values typically represent, zero values, positive values etc.)?
- Select and research a Spectral Index (other than NDVI or NBR) from this list: https://www.nv5geospatialsoftware.com/docs/AlphabeticalListSpectralIndices.html and write a brief description of the index, including its use and the bands or wavelengths used.
Part 1 Turn In: NDVI Activity (NDVI Data Form and CANVAS)
Answer all of the questions above in Canvas and submit your NDVI data per the instructions on Canvas.