Note: I have not been able to get the following script to work with ArcGIS Pro - extra credit to anyone that can get it to work!
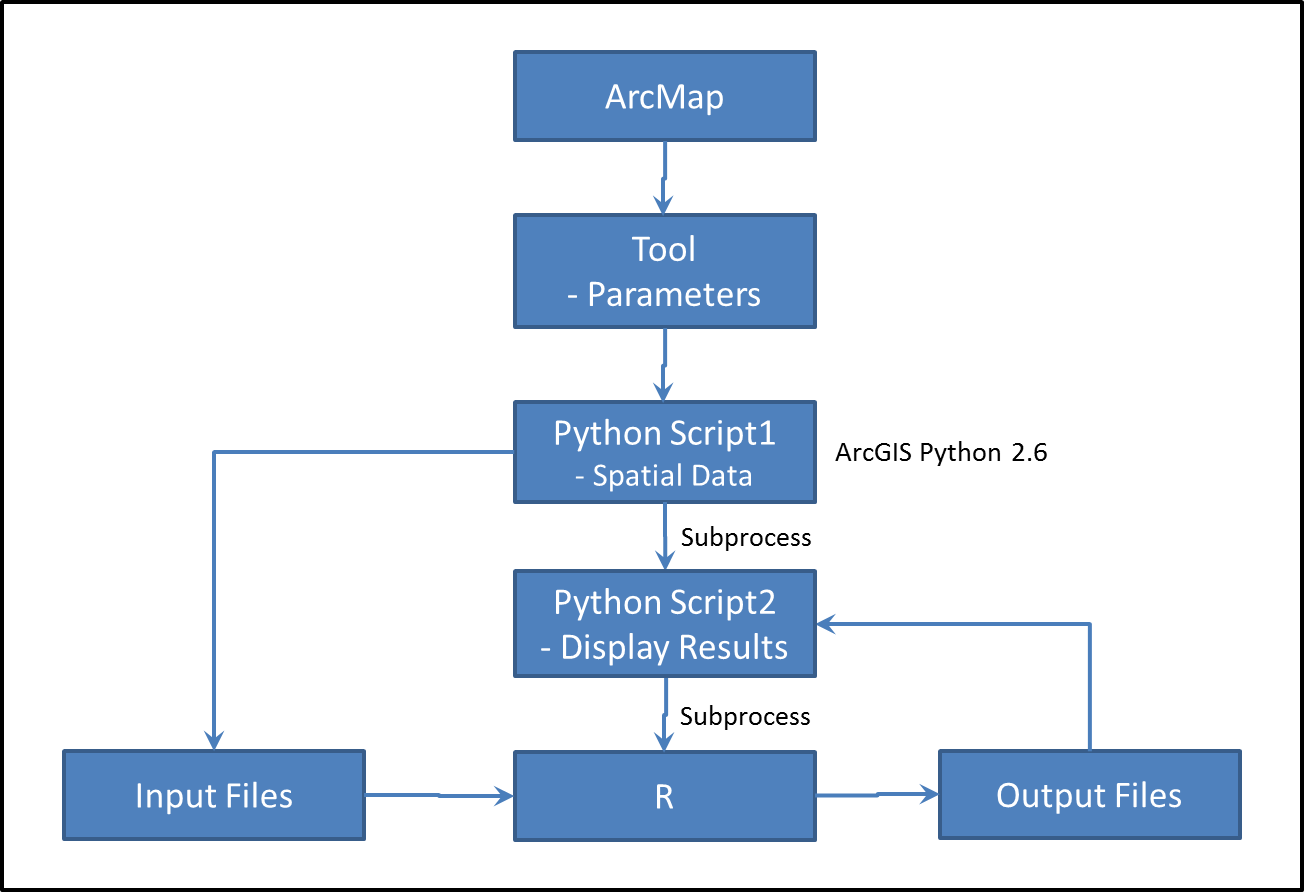
You now have all the skills needed to create virtually any tool for ArcMap that can be created. You can circumvent the problems introduced by ArcMap crashing and Esri modifying Python 2.7 by having a tool call a Python script that launches another Python script. This script can then call other programs, like R, and then display results in a GUI without the lock up problems experienced with ArcGIS. This adds some complexity but this is made up for in the flexibility you'll gain. Note that we have had problems with Python scripts sublaunching other scripts under ArcGIS Pro.

One of the most powerful tools for statistics is "R". R contains a huge number of statistical functions and is free! R is not directly supported within ArcGIS but R is a programming language in it's own right and you can create scripts for R to execute. The problem is that R and ArcGIS do not play well together and this can crash ArcGIS. The solution is to create a Python script that is sublaunched by another Python script.
The example below will show you how to create a tool in ArcGIS that sublaunches another Python script that then calls R. Don't worry too much about the R code but you have seen all the Python methods used here during this class. Below is a link to a zip file with both scripts:
RRegression.py is the script that calls R to have it perform linear regression and then displays the result in a dialog. The steps to have this process work are a bit more complicated than we have seen in the past. To test this script:
Take a look at the "C:/Temp" folder and you should see the following files:
Debugging these scripts can be a bit challenging. If you have problems, one approach is to load the "R" script into R and run it to see if it is having problems. Also, make sure the file paths and folders are setup as needed.
The script above have been setup to read the "Plot Title" and labels for the x and y axis from the command line. The script then adds some lines of code to the "R" script to create the variables for the title and labels. Try running the script from the command line and changing the title and labels.
RegressionTool.py is the Python script that will be added to ArcGIS as a tool script. Before creating the tool, lets run it in an IDE.
Before starting, you'll want to:
Now, run the script in the Wing IDE.
The final step is to create a tool in ArcGIS and have it call the script. Create the tool with the follownig steps:
Run the tool but don't be surprised if you have some issues. Go back and add message boxes and "AddMessage()" function calls until you find the problem. You can also go back through the steps above to make sure all 3 scripts are working.
When the tool works, you should see your graph appear in a "tkinter" window over ArcGIS. You'll also see a Python command window and the regular "Script" window within ArcGIS. On closing the "tk" window, the other windows should also close without locking up ArcGIS!
The code above works and should be able to integrate a large number of different applications into ArcGIS. You'll still want to plan on problems with working directories and versions of Python, ArcGIS, R, and other packages and applications.
© Copyright 2018 HSU - All rights reserved.