Lab 5: Advanced ENVI Modeler and Time-Series Classification
Introduction
In this lab exercise, we will learn more with the ENVI Modeler. Specifically we will focus on creating bath-[rpcessing tools to aid in reducing workflow time. ENVI Modeler also helps improve consistency in data processing for time ersies analysis.
About the Data
The primary data used in the lab are Landsat 8/9 Collection 2 Level 2 Surface Reflectance images of the region impacted by the 2021 Dixie Fire. The Dixie Fire began in Butte County on July 13, 2021, and burned nearly 1 million acres. A total of five Landsat8/9 scenes will be used in the analysis, all scences are from from mid-July and are cloud-free. The first image represents the pre-fire condition (7/11/2021) and each subsequent year following the fire.
Unsupervised Classification in ENVI
Unsupervised classification can be ran through the Classification Workflow or by selecting either K-Means or IsoData classification under the Unsupervised Classifications tools. The unsupervised classification algorithm in the Classification Workflow is IsoData. The workflow also includes optional clean-up filtering to smoothing and aggregation.
- ised Classification. Select the K-Mean Classification tool in the toolbox under Unsupervised Classification.
- In the Classification Input Window select the Sentinel-2 mosaic as the input file. After selecting the file you can choose to classify a subset of the data or apply a mask. For this exercise we want to mask the Data Ignore values (no-data regions of the image). This can be done by selecting a pre-made no-data mask or by having ENVI create on as part of the classification procedure. Click on the Mask Option button and select Mask Data Ignore Vales [All Bands]. This will build a no data raster mask that will be applied to the data prior to classification.

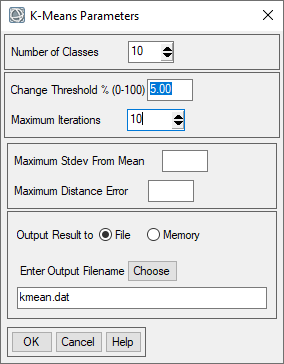
- In the next window you can specify the K-means parameters. For this exercise set the number of classes to 10, the change threshold to 5% and the maximum iterations to 10. Save the file as "kmeans.dat" in your working folder.
- The K-means classifier will start, it may take awhile to run through the iterations of the algorithm. The classification results will appear when complete.
- Now we will repeat the unsupervised classification process but this time with the Isodata algorithm. Select the IsoData Classification tool in the toolbox under Unsupervised Classification.
- Select the Sentinel-2 stack as the Input Raster and set the mask to be the data ignore mask that was created in the previous step. Click OK.
- Use the same number of classes, change threshold percent and iterations as the K-means (step 5) and save the output raster as isodata.dat in your working folder.
View Image Classification Statistics and Histograms
- Visually inspect the two classification results and compare them to each other and to the satellite imagery. Make note of similarities and differences between the classifications.
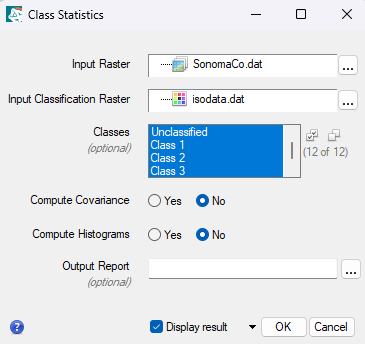
- We can also examine the statistics for the classes for each of the classifications. In the toolbox under the Post Classification heading select Class Statistics.
- In the Class Statistics Window select the Sentinel-2 mosaic as the Input Raster and select the Isodata classification file and click OK. Under the classes heading, all of the classes. This will compute the statistics from the Sentinel-2 data for each of the classes. Click OK to run the statistics.
- The statistics window will show general class summary, including the pixel count for each of the classes. You can also view the spectral data, including the mean and standard deviation for each of the classes. This will give you an idea of the spectral profile and data ranges for each class. It will also provide some information on the variability of each class.
- Review the statistics and summary graph. Take screenshots and save copies of the statistics for your lab report.
- Repeat the process for the IsoData classification file (steps 11-14).
Interpreting, Labeling and Changing Colors of Classes
xxxx
Create Mask for Vegetation
For the supervised classification in the next section we are going to perform a vegetation classification. To improve the classification, we will mask all areas that aren't vegetated by creating a vegetation mask that removes/hides all of the non-vegetated areas in the image.
Turn In - Worksheet and Text file
Upload to Canvas
- Completed Lab 4 Questions (see Canvas)
- Land Cover/Classification Maps (2)
- 1) Cleaned-up Unsupervised Classification Results
- 2) Supervised classification showing only vegetation features.
- Both maps should include the following elements.
- Legend
- North arrow
- Scale Bar
- Title