Arctic Sea Ice News & Analysis
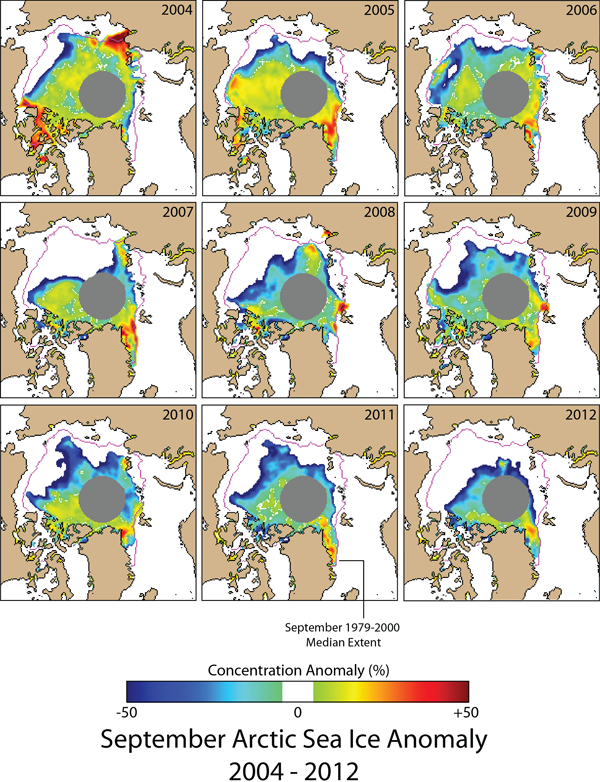
Extent anomaly maps, 2004-2012: Sea ice conditions for the month of September, 2004 through 2012, derived from the NSIDC Sea Ice Index. Each image shows the concentration anomaly (see color key) and the 1979-2000 mean September ice edge (pink line). Nearly every year, the ice edge is well north of its mean position off the coasts of Alaska and Siberia. Image provided by National Snow and Ice Data Center, University of Colorado, Boulder (National Snow and Ice Data Center).
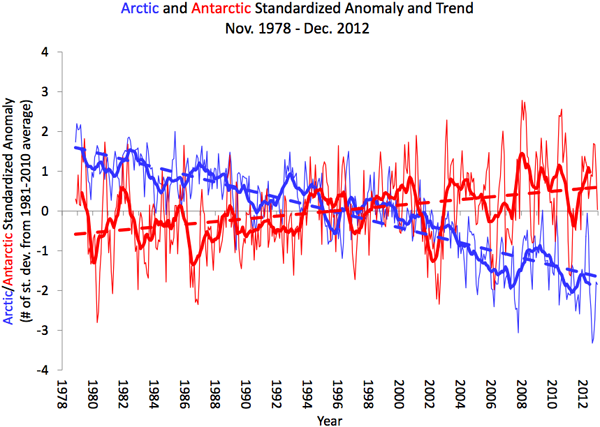
Arctic and Antarctic Sea Ice Extent Anomalies, 1979-2012: Arctic sea ice extent underwent a strong decline from 1979 to 2012, but Antarctic sea ice underwent a slight increase, although some regions of the Antarctic experienced strong declining trends in sea ice extent. Thick lines indicate 12-month running means, and thin lines indicate monthly anomalies. See the Arctic Sea Ice FAQ for more information. Image provided by National Snow and Ice Data Center, University of Colorado, Boulder (National Snow and Ice Data Center).
Antarctic Ozone Hole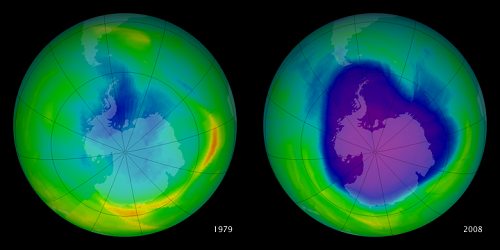
These images show the increase in the ozone hole. Due to global restrictions on CFCs, the ozone layer is expected to recover by 2040.
GIS is now being used by a huge number of different disciplines.
From Bolstad: From Archaeology to Zoology
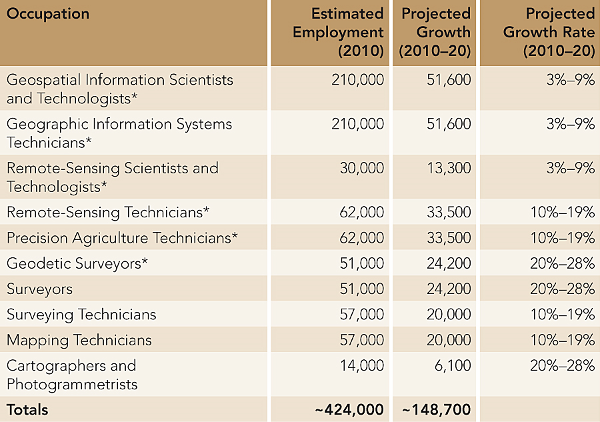
From: O*NET OnLine
From: URISA
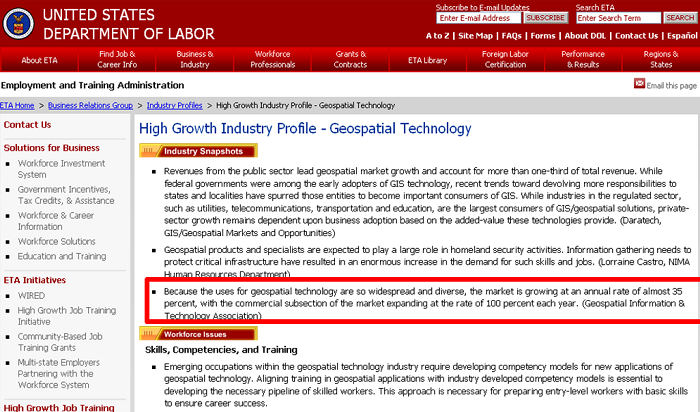
"Because the uses for geospatial technology are so widespread and diverse, the market is growing at an annual rate of almost 35 percent, with the commercial subsection of the market expanding at the rate of 100 percent each year. (Geospatial Information & Technology Association)"
© Copyright 2018 HSU - All rights reserved.