Finding correct watersheds and stream networks is critical for modeling hydrologic flow and other characteristics for watersheds. Watersheds define an area that has all water that fell into it coming out of the same location, known as a pour point. This ignores any diversions of water outside the watershed from features like dams. The stream network defines the approximate centerline, or thalweg, of the rivers and streams within the watershed. The create these two data sets we first need to define the pour point for each watershed and then create a direction raster.
The pixels in the direction raster define the direction that water flows from one pixel to another in the watershed. The key challenge is to obtain a direction raster that has all the pixels flowing downstream in the right direction. This is a challenge because modern DEMs can contain "sinks" that will appear to drain all the water in a sub-basin of a watershed into a pixel that is not the correct pour point. Similarly, it is challenging to determine the flow of water across large areas that are very flat and the exact same elevation value.
The approach described below is designed to produce correct watersheds, stream networks, and direction rasters from just about any DEM. This data can then be used to model the flow of water, sediment, and pollutants in a watershed.
Note that the material below is about creating watersheds and stream networks for analysis rather than cartography. The goal is to create precise data sets rather than ones that are artistically pleasing. This can could be simplified, generalized, and smoothed to create data for cartography.
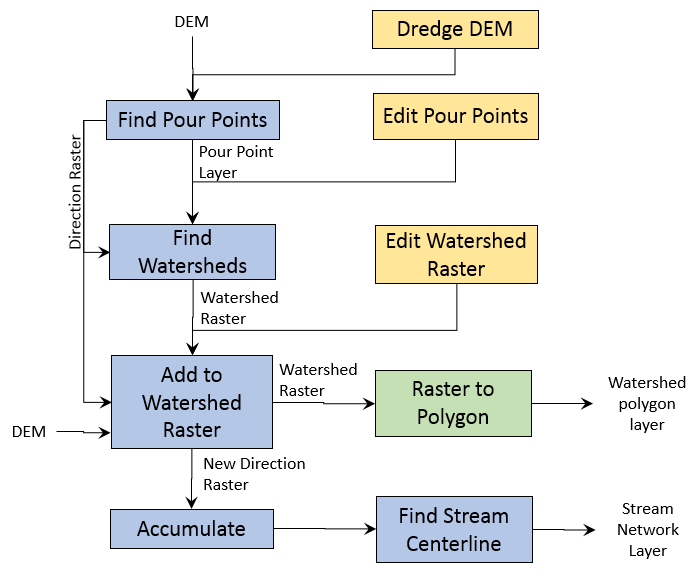
The overall approach is to take an existing DEM and go through the automated processing steps one by one. This includes, finding the pour points for the watersheds, finding the watersheds from the pour points and direction raster, adding pixels that are behind sinks or in flat areas to a watershed, finding the accumulation raster, and then finding the stream centerline network. A final step is converting the watershed raster to polygons. During the process, the DEM may need to be edited or "dredged" to remove dams and other obstacles to creating a proper direction raster. Also, the user may want to change the pour points for the watersheds. Finally, the watershed raster can be edited if needed.
The process starts with a DEM. You'll want to open the DEM and make sure that it is properly georeferenced. You do not have to worry as much about artifacts in the DEM as with other methods as BlueSpray will flow water over artifacts in a DEM. You may see some minor diversions with this but we recommend you go through the process once and evaluate the final data products. If there are problems, you can then edit the data and repeat some of the steps.
This process can take a long time for larger DEMs (over 10 million pixels) and we recommend using a relatively small one to start (less than 1 million pixels or about 200x200 pixels). Load the DEM into BlueSpray. When you are creating DEMs for analysis, you'll want to make sure the DEM contains the entire area of the watershed you are interested in. For now, just select a small area that you are familiar with to learn the process. Also, BlueSpray keeps data in RAM that it is processing. This makes BlueSpray very fast but also limits the size of rasters it can process. This is typically not a problem with the cost of RAM these days but keep in mind that if you want to process very large rasters, you will need to have a computer with lots of RAM (32Gig is good) and then allocate a large portion of the RAM to BlueSpray (20Gig is all I ever need).
Note that all of the steps below require data that is exactly the same extent, projection, and of specific data types.
The following steps can be access by right-clicking on a layer in BlueSpray and going to the "Transforms: Water" menu. The steps are numbered and all appear for raster layers. Finding the initial watersheds is also available in a point layer. The fist two steps, "Fill One Pixel Sinks" and "Find Flow Direction" are not needed as they are built into the "Find Pour Points" transform.
Right click on the DEM layer and select "Transforms: Water -> Find Pour Points". There are options for whether the transform will find sinks that are not along the edge of the raster. YOu may want to try these if you have an area that contains a number of sinks like Mono Lake where the water does not actually drain to the ocean. For now, just click "OK".
You should see a "Pour Points" layer appear and points should be displayed around the edge of your DEM. These are the pour points. Don't be surprised if there are a lot of them. Each set of pixels that flow "down" into a unique pixel are given a pour point. Along the boundary of water bodies there are a lot of small streams that flow direction into the body of water. Each of these are in effect their own little watershed and will be identified. The same effect occurs when we crop the sides of a raster.
If your area of interest creates a real sink such as a depression like Death Vally where water flows in but does not flow out, you may want to edit the Pour Point layer at this point to add a pour point in the middle of these areas. This is often simpler than finding interior pour points and then deleting them.
You will also see the initial direction raster layer appear and arrows appear over your DEM. If you are zoomed out, the arrows show you the direction of one of the pixels under the arrow. Zoom in until you see individual pixels in the DEM and you'll see that the arrows point in the direction of flow from one pixel to another. You will also see circles where the flow has ended in a sink. There will be boxes in pixels where the flow has not been determined because all the pixels have a same value or represent a "flat" area. If the flat area is surrounded by pixels of a higher elevation, the boxes will contain circles to indicate a "Flat Sink". Otherwise, the flat area will be a "Flat Ledge".
Right click on the Pour Point layer and select "Transforms: Water -> Find Initial Watershed Raster". Make sure the direction raster from the previous step is selected in the "Direction Raster" option. When you click "OK" a dialog will appear with the results. Click "OK" to see your initial watershed layer. Typically the center of your DEM will contain a large area of pixels that do not yet have a watershed associated with them. They are colored red. These are the pixels that did not drain to a pour point because of a sink or flat area.
The next step is to add the unknown pixels to the watershed raster. Right click on the Pour Point layer and select "Transforms: Water -> Find Initial Watershed Raster". Make sure the correct Direction Raster and Elevation Raster are selected and click OK. With a large raster, this step can take quite a while. You should see a dialog with the number of pixels that were added to the watershed raster and the watershed raster should now be complete. Move the pour point and direction layers on top of the watershed raster to evaluate if the watershed appears correct.
Note that your direction raster has been updated to have all sinks and flat areas flow into one of the pour points.
Right click on the Direction layer and select "Transforms: Water -> Find Accumulation " and click OK. You should see a raster with the pixels that accumulate water flowing down to the pour points going from black (no points accumulated) to white (maximum number of pixels accumulated). The pixels with the highest level of accumulation should be coincident with your pour points.
Right click on the Accumulation layer and select "Transforms: Water -> Find Stream Network " and make sure the correct Direction layer is selected. The "Minimum Accumulation" setting determines how many pixels have to be accumulated into a pixel before it is converted into a stream segment. This setting is equivalent to the area that is drained before a stream appears. 100 is a good starting point. If you want to find smaller streams, decrease the value and increase it to reduce the number of streams found for large areas. After clicking "OK" you should see the new stream network layer appear.
Each reach within the network is represented as a feature. If you open the attributes table, you will see there is an entry for the "Order" of the reaches starting at 0 for the reach with the pour point, 1 for reaches above that one, and so on. The "DownStream" attribute contains an index into the row for the reach that is below the current reach. -1 indicates reaches at the pour points which do not have a downstream reach. This attribute can be used to convert the connected streams into a single feature.
Typically, you'll want to convert the watershed raster into a polygon layer. BlueSpray does not yet include a raster to polygon transform. ArcGIS or QGIS provide this transform.
The DEM contains values that represent elevations on the earth. To have water flow through a DEM to properly find a stream centerline, the user may need to "dredge" out bridge, culverts, and other obstructions. They may also need to indicate that a water course is underground or being planned for. Finally, some DEM have artifacts that give incorrect values and the user may need to edit the DEM to allow a clear path for flow.
To edit a DEM in BlueSpray, right click on the arrow next to the DEM layer and select "Editable". To edit the pixel values, select the pencil tool from the drop-down in the menu bar while the layer is selected. You'll see text entry box appear in the menu bar. Enter the value you want to put into the pixels and then use the pencil to "draw" the values into the raster..
In the future, we plan to offer a tool for dredging allows the user to select a start and end point for dredging. The user could also specify the shape and width of the profile of the dredge. Then, the area specified will have elevations lowered to match the dredge.
The pour point layer is a standard point layer that can be stored in a shapefile. The user can edit the points in a GIS package (including BlueSpray). The only requirement is that there is an "ID" field that has a unique number in it. There may also be a "Name" field. If the ID field is missing or has missing entries, the "Find Watershed" transform will add them.
In BlueSpray, click on the arrow next to a Pour Point layer and select "Editable". This will allow you to change the pour point layer. Then, click on a pour point to select it and press "Delete" on the keyboard to delete the pour point. To add a pour point, select the pencil tool from the drop-down in the menu bar while the pour point layer is selected. Then, click to add a pour point.
The direction raster contains numbers that represent the cardinal directions (N, NE, E, SE, S, SW, W, NW). It also contains values that identify one pixel sinks and flat sinks. The layer can be edited in BlueSpray by setting the desired value and using the pencil tool.
The direction rasters are always 8-bit signed rasters. The pixel values in the direction raster have the following values: