 R for Spatial Statistics
 Estimating Uncertainty in Raster Covariates
Remotely sensed data, typcally from satellites and airplanes, contain error within each pixel. If we downsample these rasters the error increases. The material below will allow you to esimate the amount of error in a raster after downsampling.
Note that the code contains examples of if statements, while loops and functions in R.
The code below requires the packages terra and sp Please see the R website for information on installing these packages. I also highly recommend using small rasters to get started as these functions will take much longer with large rasters.
Note: This code was just recently updated to work with terra and sp.
Function to Down Sample Rasters
The function below will create a downsampled raster where each pixel contains the mean value for each of the pixels that it overlaps within the original raster. It will also create rasters that represent the standard deviation, mininum, or maximum value from the original pixels.
###############################################################################
# Function to obtain a down-sampled raster where each pixel represents the
# mean of the pixels that it overlapped with in the original raster.
#
# Inputs:
# - OriginalRaster - The raster to be downsampled
#   CellSize - The number of pixels in the x and y directions that will be
#             downsampled for each new pixel(i.e. a 2 to convert 4 pixels to 1)
#   Type - The type of raster to be created
#         MEAN for a raster with the average value for the sub-sampled pixels
#         STDDEV for a raster with the standard deviation for the sub-sampled pixels
#         MIN for a raster with the minimum values from the sub-sampled pixels
#         MAX for a raster with max values
#         FIRST for the first value in each sub-sample.
###############################################################################

###############################################################################
# Constant definitions
###############################################################################

# these constants specify the "Type" of downsampled raster to obtain
MEAN=1
STDDEV=2
MIN=3
MAX=4
FIRST=5

###############################################################################
# The Function
###############################################################################

DownSampleRaster=function(OriginalRaster,CellSize,Type)
{
	# Get the matrix containing the pixels for the original raster
	TheMatrix=as.matrix(OriginalRaster,wide=TRUE) # terra requires "wide=TRUE" or your get a 1-row matrix

	# Get the number of rows and columns in the original raster
	NumRasterColumns=ncol(OriginalRaster)
	NumRasterRows=nrow(OriginalRaster)

	# Get the number of rows and columns in the new raster
	NumRows=NumRasterRows/CellSize
	NumColumns=NumRasterColumns/CellSize
	NumRows=as.integer(NumRows)
	NumColumns=as.integer(NumColumns)

	#NumRows=100 # uncomment this line to limit the number of rows and make processing faster for debugging
	message("NumRows=",NumRows) # print the number of rows to process

	# Create the matrix that will include the pixels for the new raster
	NewMatrix=matrix(nrow = NumRows,ncol=NumColumns) #

	# Setup a variable with the number of cells in the subset as we'll use this again and again
	NumSubsetPixels=CellSize^2

	# Initialize the row and column counters
	Row=0
	Column=0

	while (Row<NumRows) # interate through each row in the new raster (we skip the last row if partial)
	{
		Column=0 # reset the column counter to go through each column for each row
		while (Column<NumColumns)
		{

			# Find the row and column indexes into the original raster
			FirstPixelX=Column*CellSize+1 # R indexes from 1
			FirstPixelY=Row*CellSize+1

			LastPixelX=FirstPixelX+CellSize-1
			LastPixelY=FirstPixelY+CellSize-1

			# Get the Subset from the original raster that is downsampled into the new raster
			Subset=TheMatrix[FirstPixelY:LastPixelY,FirstPixelX:LastPixelX]

			# Find the mean value
			# This can be replaced by other code to find the minimum, maximum, and std. dev.
			if (Type==MEAN)
			{
				Value=mean(Subset)
			}
			else if (Type==STDDEV)
			{
				Value=sd(Subset)
			}
			else if (Type==MIN)
			{
				Value=min(Subset)
			}
			else if (Type==MAX)
			{
				Value=max(Subset)
			}
			else if (Type==FIRST)
			{
				Value=sd(Subset[1])
			}

			# Save the new value into the raster
			NewMatrix[Row+1,Column+1]=Value

			# Move to the next column
			Column=Column+1
		}
		Row=Row+1

		if ((Row%%10)==0) message("Row=",Row) # print the row every 10 rows
	}
  }
  # Create the new raster
  NewRaster=raster(NewMatrix)

  # Copy the spatial reference from the original raster to the new raster
  TheProjection=projection(OriginalRaster)
  projection(NewRaster)=TheProjection

  # Copy the raster extent (even downsampled, the extent is the same)
  # The pixels do get larger
  xmin(NewRaster)=xmin(OriginalRaster)
  xmax(NewRaster)=xmax(OriginalRaster)
  ymin(NewRaster)=ymin(OriginalRaster)
  ymax(NewRaster)=ymax(OriginalRaster)

  # return the new raster
  return(NewRaster)
}
The code below uses the function above to complete a mean or standard deviation raster by passing a defined "TYPE" to in with the function. In a standard deviation raster, each pixel represents the standard deviation of the pixels down sampled from in the original pixel. Try this for at least 3 cell sizes.
library(raster)
library(sp)
library(rgdal)

# Setup the folder and file paths (img is not supported)
FolderPath="C:\\Users\\jim\\Desktop\\GSP 570\\Lab 07\\RasterNoise/"
InputFileName="AnnualMeanTemp_CA.tif"

# Setup the input file path
InputFilePath=paste(FolderPath,InputFileName,sep="")

# Read the raster into a raster object
OriginalRaster=rast(InputFilePath)

# Setup the cell size and the type (allows for debugging)
CellSize=2
Type=STDDEV

# Get the downsampled raster
NewRaster=DownSampleRaster(OriginalRaster,CellSize,Type)

# Setup the output file path
OutputFilePath=paste(FolderPath,"NewRaster",format(CellSize),".tif",sep="")

#Save the raster
writeRaster(NewRaster, filename=OutputFilePath, format="GTiff", overwrite=TRUE)

# convert the raster to a matrix that R can perform stats on
TheMatrix=as.matrix(NewRaster,wide=TRUE)

# Find the mean of the overall raster
OverallMean=mean(TheMatrix, na.rm=TRUE)
Monte Carlo
The code above can be used to characterisze the noise that may be in a remotely sensed raster. It can also be used to generate noise in a modeling process by using either the statistics on the noise in the overall raster or by using each pixel in a standard deviation raster to inject noise into the raster layers that are used as covariates.
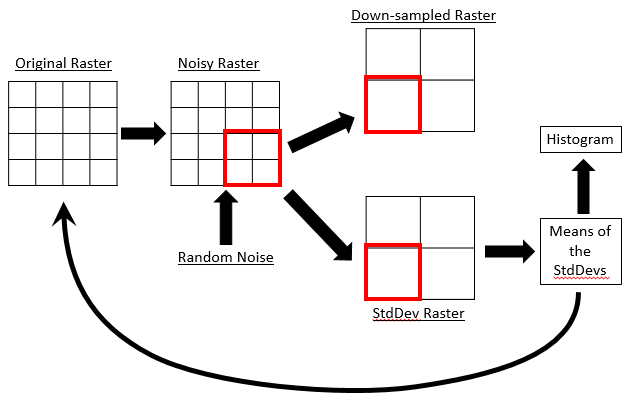
The image below illustrates characterizing the impact of noise on our raster layers. The "Original Raster" is the one we started with. We take it and add some "random noise" to create a noisy raster. This is simulating the process of collecting another dataset without having to go out in the field. Typically we would down sample this raster and then use it in our models. To understand the nature of the noise we can create a raster with the standard deviation of each of the pixels in the Down-sampled raster instead. if desired, we can record the means of the standard deviation rasters and repeat the process a number of times. When done, the histogram will show the effect the noise is having on your raster covariate layers.
Additional Resources
Introduction to the "Raster" package