 R for Spatial Statistics
 Cluster Analysis
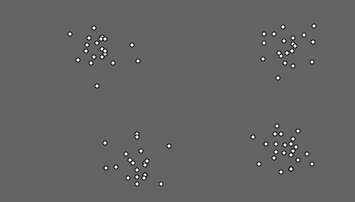
A common problem in spatial statistics is to determine if features are clustering into groups and if so, what groups are they clustering into. The image below shows a set of points manually generated for evaluating different algorithms. It may be much harder to see the clusters in real world data.
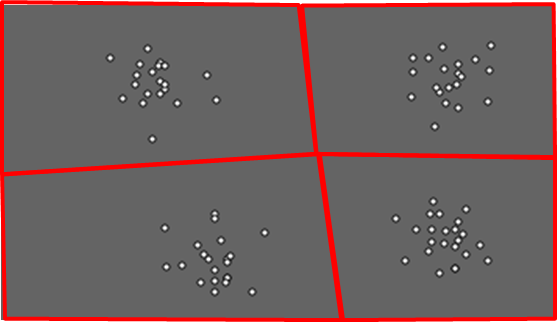
In the example above, it is relatively easy to see the clusters and the result might be something like that shown below.
There are a huge number of different clustering algorithms available in R. K-Means clustering is one of the most common clustering approaches.
Finding Clusters
The first step is to find the clusters within a set of points and which cluster each point belongs to. The code below executes the K-Means clustering algorithm assuming there are two clusters and then plots the results. The code assumes that the "Randome.csv" file contains only two columns with x and y coordinate values (i.e. just numbers). You can change the number of clusters in the kmeans() function to try other numbers of clusters.
# read the data into a data table
TheData = read.csv('C:/ProjectsR/Clustering/Random.csv')

# Prepare Data
TheData = na.omit(TheData) # delete null entries
TheData = scale(TheData) # standardize variables

# K-Means Cluster Analysis
ClusterInfo = kmeans(TheData, 2)

# Put the result using the cluster to colorize the points in each cluster
plot(TheData, col = ClusterInfo$cluster)
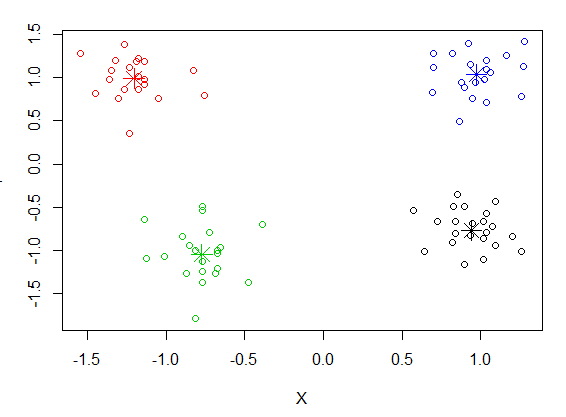
The following code will add the centers of the clusters to the plot. You'll need to change the col=1:4 to go from 1 to the number of clusters.
# add the centers of the clusters
points(ClusterInfo$centers, col = 1:4, pch = 8, cex = 2)
The result of running this code is shown below.
There is a great deal of information hidden in the object that is returned from kmeans(). You can see this by printing the object. You can also split out the points that are in each cluster using the "split()" function.
Clusters=split(TheData,ClusterInfo$cluster)
Find The Optimal Number of Clusters
A key problem in cluster analysis is finding the "best" number of clusters within a set of data. The code before loops through 2 to 15 clusters to find the sum of squares distances for the points.
# read the data into a data table
TheData = read.csv('C:/ProjectsR/Clustering/FourClusters.csv')
# Prepare Data
TheData = na.omit(TheData) # list wise deletion of missing
TheData = scale(TheData) # standardize variables
# find the variance
TheVariance=apply(TheData,2,var)
# find the sum of squares for 1 cluster
WithinClusterSumOfSquares = (nrow(TheData)-1)*sum(TheVariance)
# find the sum of squares for 2 to 15 clusters
for (i in 2:15) {
ClusterInfo=kmeans(TheData, centers=i)
WithinClusterSumOfSquares[i] = sum(ClusterInfo$withinss)
}
# plut the result
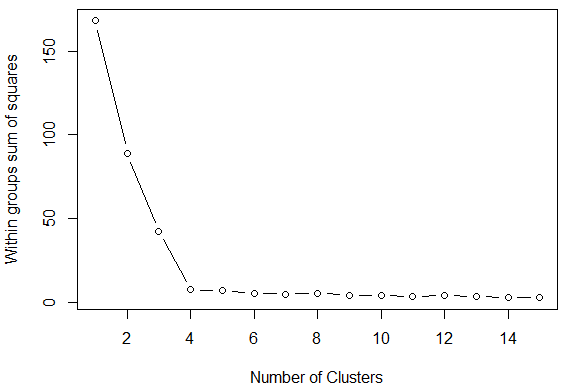
plot(1:15, WithinClusterSumOfSquares, type="b", xlab="Number of Clusters",ylab="Within groups sum of squares")
The result is show below. The "elbow" at 4 points shows that there is little improvement to be gained by adding additional clusters.
Hierarchical Cluster Analysis
There are times when clusters appear at different levels of distances. In other words, you can have clusters at one spatial scale (countries) and then find another, more detailed set of clusters at another scale (counties). The code below uses a data set that is built into R on data on automobiles to create a "dengrogram" that shows how the cars "cluster" across mulitple variables.
d = dist(as.matrix(mtcars))   # find distance matrix
hc = hclust(d)                # apply hirarchical clustering
plot(hc)                       # plot the dendrogram
We can now apply this approach to our data from above:
#Convert the data matrix into a data frame with x,y coordinate values
TheDataFrame <- data.frame(x=coordinates(TheData)[,1],y=coordinates(TheData)[,2])

# Find the distance matrix between the points
TheDistances=dist(TheDataFrame)

# Find the hierarchical clusters (tree)
TheTree=hclust(TheDistances)
plot(TheTree)
You'll see that this is a very complex tree.
Additional Resources
Portions of this web page were adapted from Quick-R