 R for Spatial Statistics
 Testing for Normality (QQ-Plots)
QQ-Plots
QQ-Plots are a more robust test for normality and provide visual feedback on the nature of the data. It is also recommended to histogram the data to see if it appears normal.
Executing a QQPlot in R is really easy:
TheVector=rnorm(1000,mean=0,sd=1)
qqnorm(TheVector)
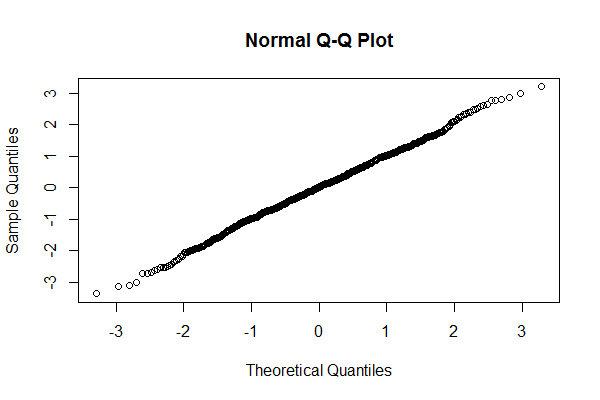
If the points in the Q-Q plot are on a line from the lower left to the upper right then the data is basically normally distributed.
Try playing with different sets of data and Equations in this online tool to see the impact on the Q-Q Plots.
How Q-Q Plots Work
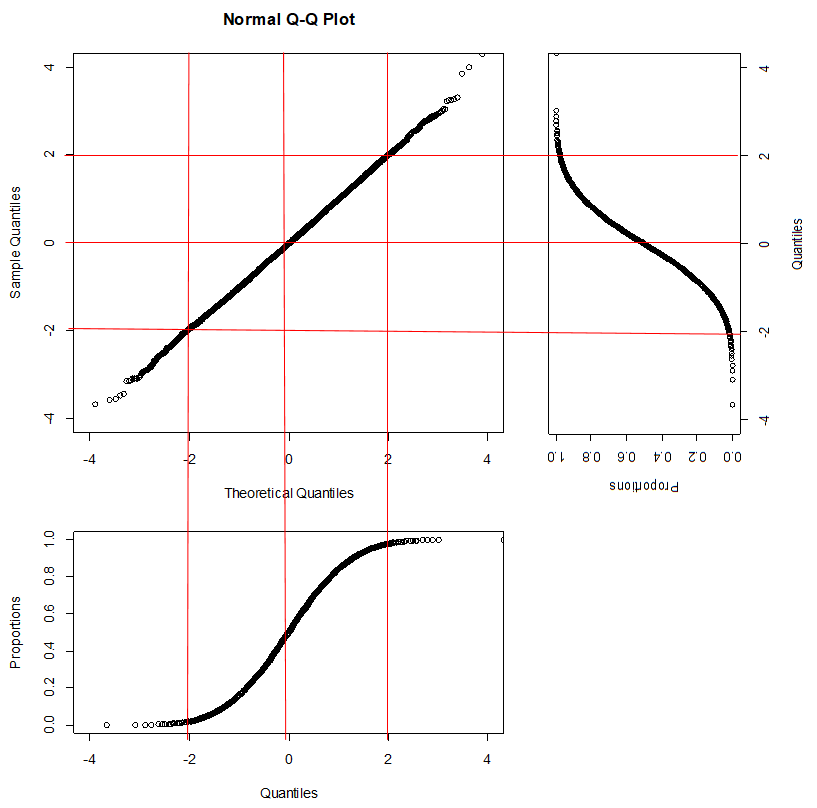
Q-Q Plots can be a bit tricky to understand. Q-Q Plots use "Quantiles" which are just proportions of the data that is to the left of an x-value in a histogram. In the diagram below, we have 1% of the data to the left of a value at about -3.5. Thus, -3.5 is the 1% quantile. As the percent of data increases, the quantiles also increase but in a non-linear fashion as show in the lower graph. When we reach 50% we are at 0, the mean of the distribution. At 99% of the data, we are about 3.5. Q-Q Plots are created by generating the quantile values for percentages from 0 to 100%. This is done for theoretical perfect distribution and then for your data. The quantiles are then plotted against each other.

The figure below shows how the quantiles are used to create a Q-Q Plot for a normal distribution. Both of the quantile plots were created in R using the quantiles(...) function. This figure shows that the two sets of quantiles have to increase at the same rate (i.e. have similar distributions) for there to be a Q-Q Plot with a fairly straight line from the lower-left corner to the upper-right corner.
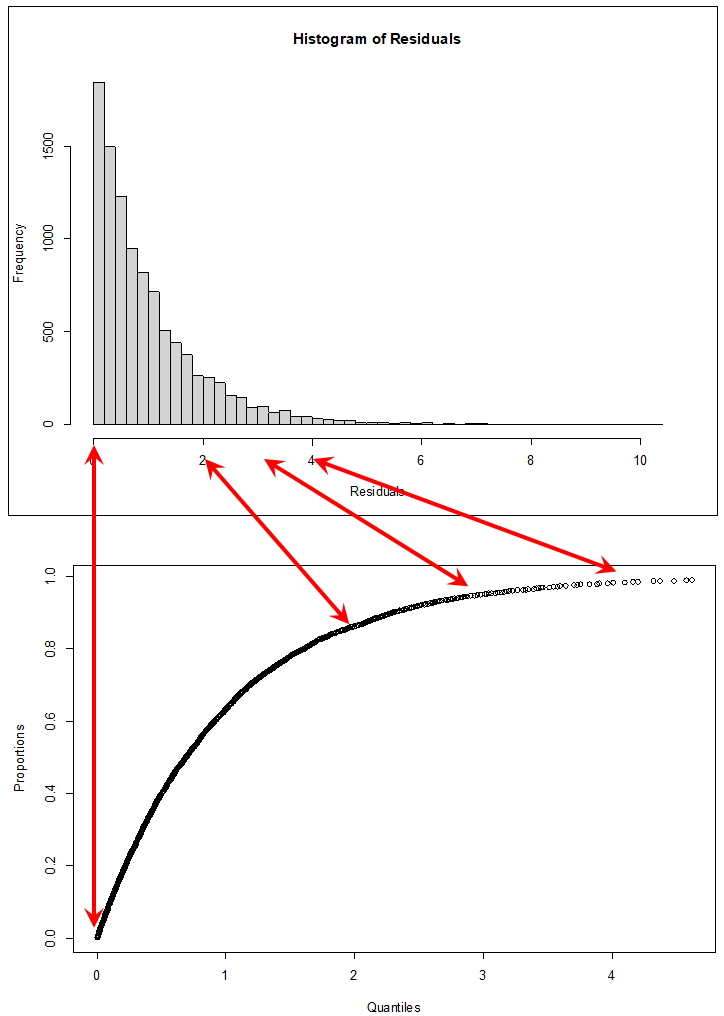
Below is a figure for some data from a gamma distribution. The values for the quantiles are no very different because the distribution is heavily skewed to the left.
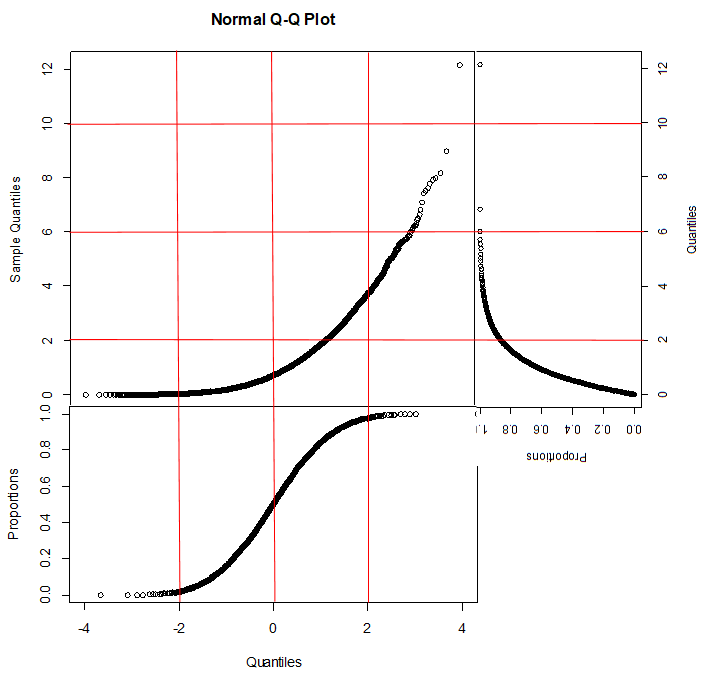
When we create a Normal Q-Q Plot against data that is not normally distributed, we end up with a plot that is not a straight line from one corner to the next. This is because the quantiles do not increase at the same rate.
Other Resources
Issues with Tests for Normality