Quantitative Data
It is important to make sure your research project includes some form of quantitative data. Below are some common methods for extracting quantitative data from imagery and analysis.
Calculating the Area for Raster Files
See Lab 9 for general information about how to calculate area of raster files and classes. These methods can work for classified data (thematic), data that has classified symbology or analyzing the output of the raster calculator.
Area from Raster Attribute Table
In ArcMap right click the raster file in the Table of Contents and select Open Attribute Table. The Attribute Table provides us with a count of the number of pixels in each category/class. You can use the pixel count to calculate the area associated with each class by referencing the spatial resolution of the raster file.
In ENVI right click the raster file in the Layer Manager and select Quick Stats. Under the Histogram Label it will show each class (DN) and the pixel count (Count). You can use the pixel count to calculate the area associated with each class by referencing the spatial resolution of the raster file.
Area of Classes from Indices
You can calculate the area by looking up the number in pixels in each of classes (Burn Severity, NDVI classes etc) and multiplying by the area of one pixel (900 sq meters for most Landsat imagery (30m)). The classes could represent similar NDVI values, burn seveirty classes or the difference in classes between two time periods (decrease, no change increase). In ArcGIS this can be done useing the reclass function.
Area of Classes within a Shapefile or ROI
Shapefile In ArcMap
If you have a shapefile, you can use the Zonal Histogram Tool in ArcMap to calculate the area of each class within the shapefile. From ArcToolbox, select Spatial Analysis Tools → Zonal → Zonal Histogram. The Zonal Histogram window opens. Under Input raster or feature zone select your shapefile. Leave the Zone field the default and select your raster file (dNBR, NDVI etc) as the Input value raster. You can leave the Output table as the default name and location. Click OK. A table containing the zonal histogram results will now be in the Table of Contents. Right click on this file and select Open. The table opens showing the number of pixels inside the shapefile in each category.
ROI in ENVI
After importing or creating your ROI, in the ROI Tool menu select Compute Statistics. In the Statistics window under the Histogram Label it will show each class (DN) and the pixel count (Count). You can use the pixel count to calculate the area associated with each class by referencing the spatial resolution of the raster file.
Area of Polygons
Shapefile In ArcMap
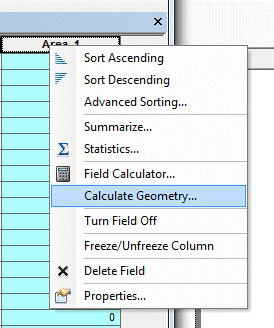
First create a new shapefile and digitize your features. See Right click on the shapefile you want to calculate the area for and select “Open Attribute Table”. In the upper left hand corner of the attribute table window, click on the Table Options icon to open up the menu options. Select the “add field” option. When the “add field” dialogue box appears, type in the name of the field that will store the area values (e.g. name it “area”). Select “double” as the field type. Next, set your precision and scale values. Enter your values and hit the “OK” button to add the new field. Right click on the new field and select the “calculate geometry” option on the menu. Click “Yes” to move past the editing session warning that pops up. In the “calculate geometry” window, select the “area” option from the drop down menu at the top of the form. Finally, select the units you want the area calculation to be in. Hit the “OK” button to run the area geometry calculation. The area calculation will then run and your area field will be populated with the area values.
ROI in ENVI
After creating your ROI, in the ROI Tool Window click on the "Area" tab. By default the area is shown in pixel. Click on "Units" in the Area toolbar to change the units.
.Measure Linear Distance
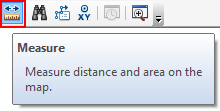
Both ArcMap and ENVI have measure tools to measure the linear distance between points.
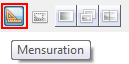
ENVI: From the Toolbar select the "Mensuration Tool" which will allow you to measure between two points.